
Amazon's Second Act
A segment-by-segment breakdown of retail, AWS, Advertising, and Custom Silicon — with a full DCF and P/E valuation model

Executive Summary
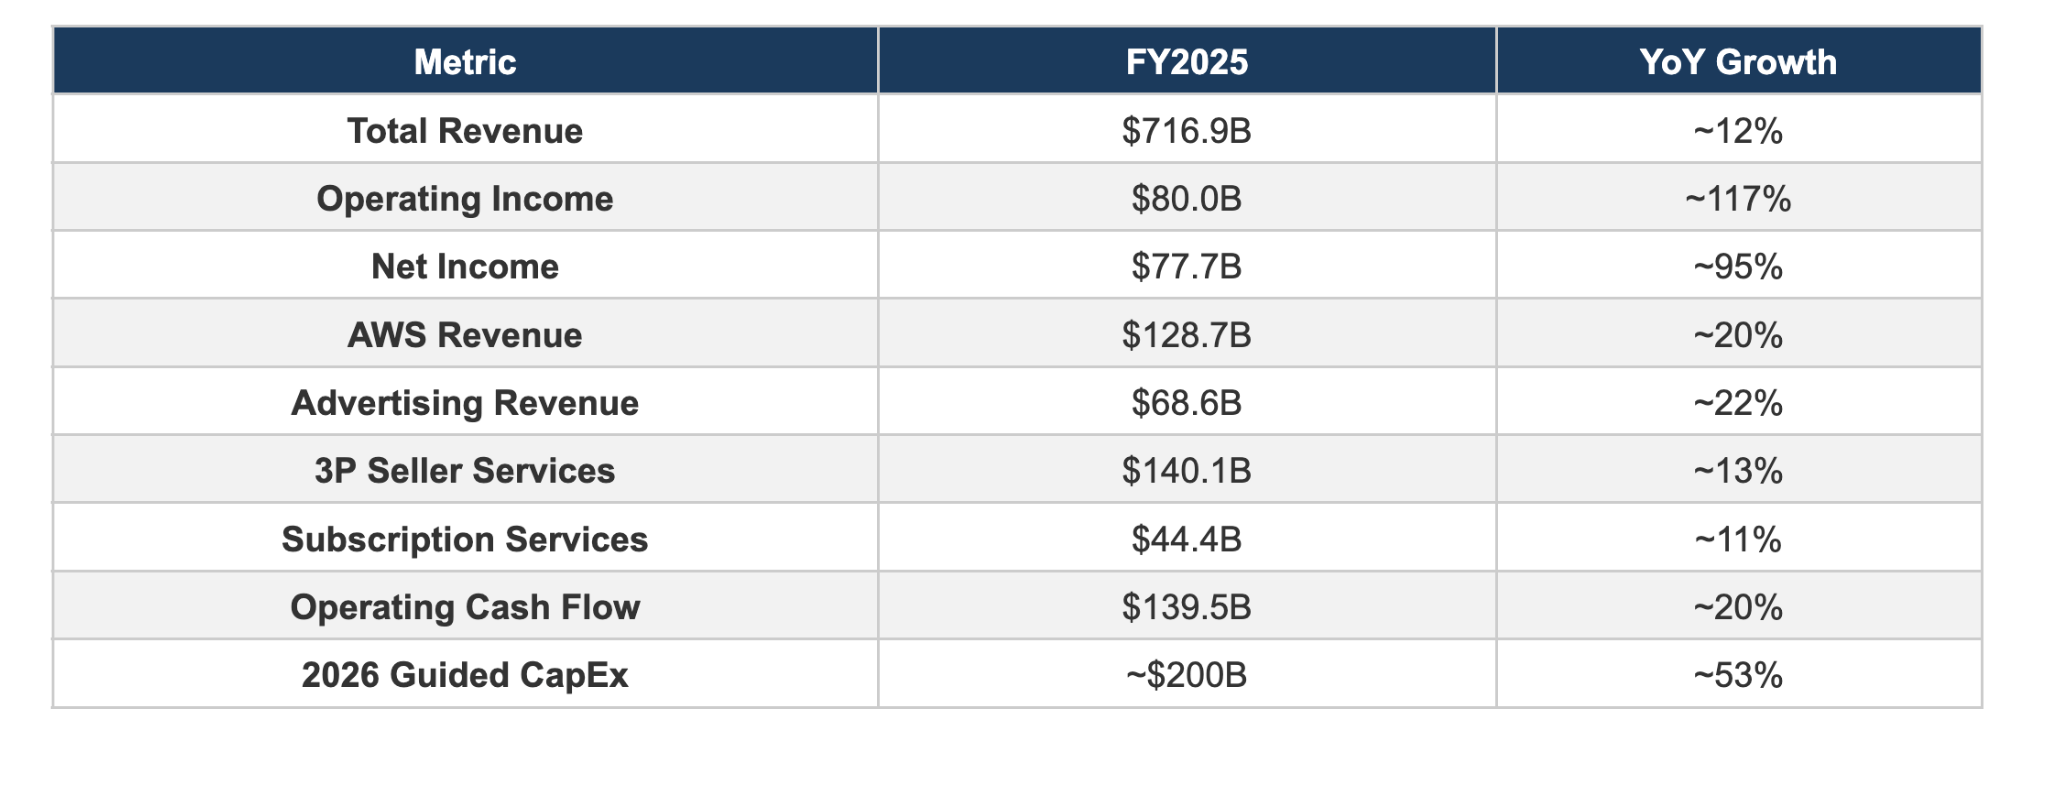
Amazon closed fiscal year 2025 as a $717 billion revenue juggernaut, but its investment thesis has fundamentally shifted. The company is no longer primarily a retailer that happens to run a cloud business. It is now an infrastructure and services platform that happens to sell products online. AWS ($129B), Advertising ($69B), Third-Party Seller Services ($140B), and Subscriptions ($44B) collectively generated approximately $382 billion in revenue in 2025, representing 53% of total sales but an even larger share of total operating profit.
Operating income surged to $80 billion in 2025, up from $36.9 billion in 2024, driven overwhelmingly by AWS margin expansion and the rapid scaling of near-pure-margin advertising revenue. Net income reached $77.7 billion. Perhaps most critically, Amazon’s custom silicon program, spanning Graviton, Trainium, and Nitro, has crossed the $20 billion annualized revenue run-rate and is growing at triple-digit rates, creating a structural cost advantage that competitors cannot easily replicate.
This report provides a deep dive into each of Amazon’s high-margin segments, analyzes the financial implications of its custom chip strategy, and constructs both a Discounted Cash Flow (DCF) and Price/Earnings (P/E) valuation framework projecting fair value through 2031.
1. The Retail Foundation: A Brief Overview
Amazon’s retail operations remain the gravitational core that powers its higher-margin flywheel. The online stores segment generated approximately $264 billion in 2025, while physical stores (primarily Whole Foods) contributed roughly $22 billion. North America segment sales reached $426.3 billion (up 10% YoY), while the International segment hit $161.9 billion (up 13% YoY).
Retail is important not for its margins, which remain thin in the low-to-mid single digits, but for the ecosystem it creates. Every new Prime member, every new third-party seller, and every product search on Amazon.com feeds the higher-margin businesses. Consumer intent data underscores the moat: 62% of consumers plan to increase their Amazon spending over the next year, compared to 53% for Walmart and just 23% for Target. The company’s same-day and next-day delivery capabilities, now covering 60%+ of U.S. orders, continue to widen the competitive gap. Amazon’s regionalized fulfillment network, where robotics now handle approximately 75% of global delivery volume, has reduced delivery costs per unit by over 15% since 2022 while simultaneously improving speed.
The international segment turned meaningfully profitable in 2025 after years of losses, posting positive operating income for the full year as India, Europe, and emerging markets scaled past the investment phase. While retail will never be a margin story, it is the indispensable foundation upon which Amazon’s highest-value businesses are built.


2. Amazon Web Services (AWS): The Profit Engine
2.1 Current Performance
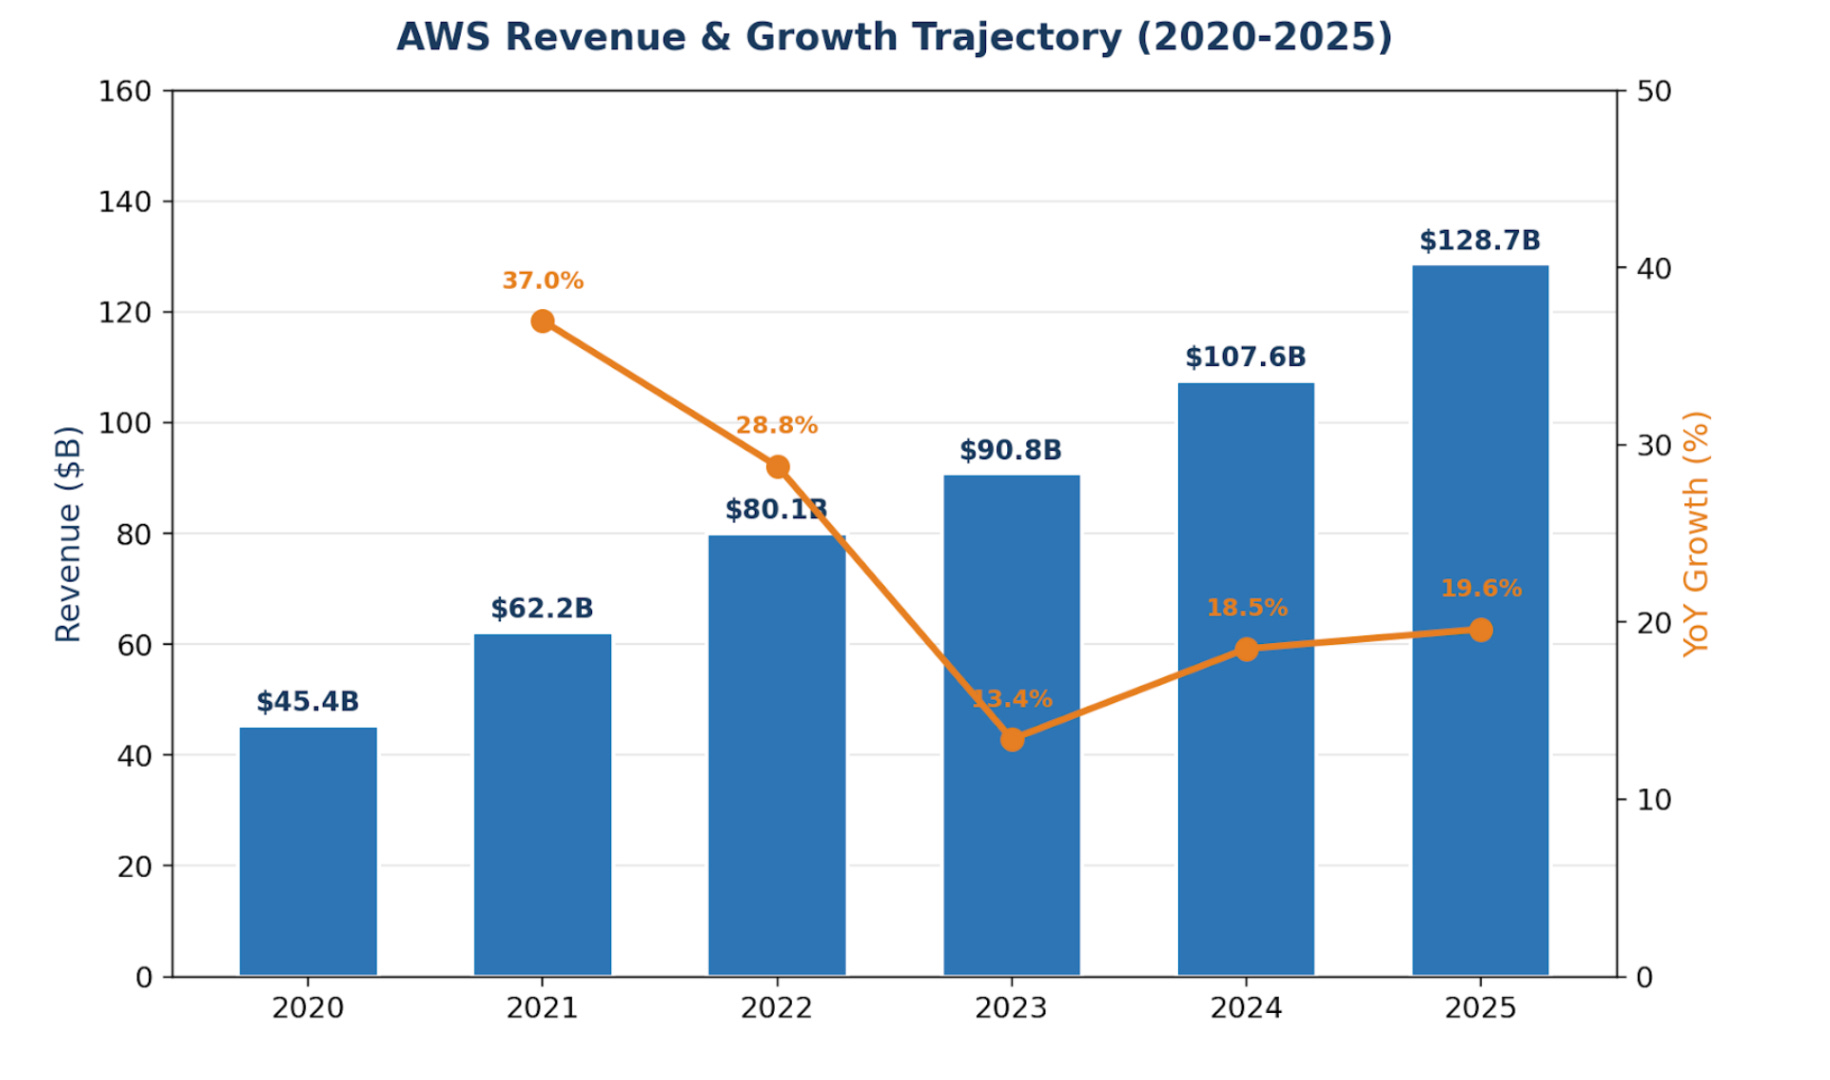
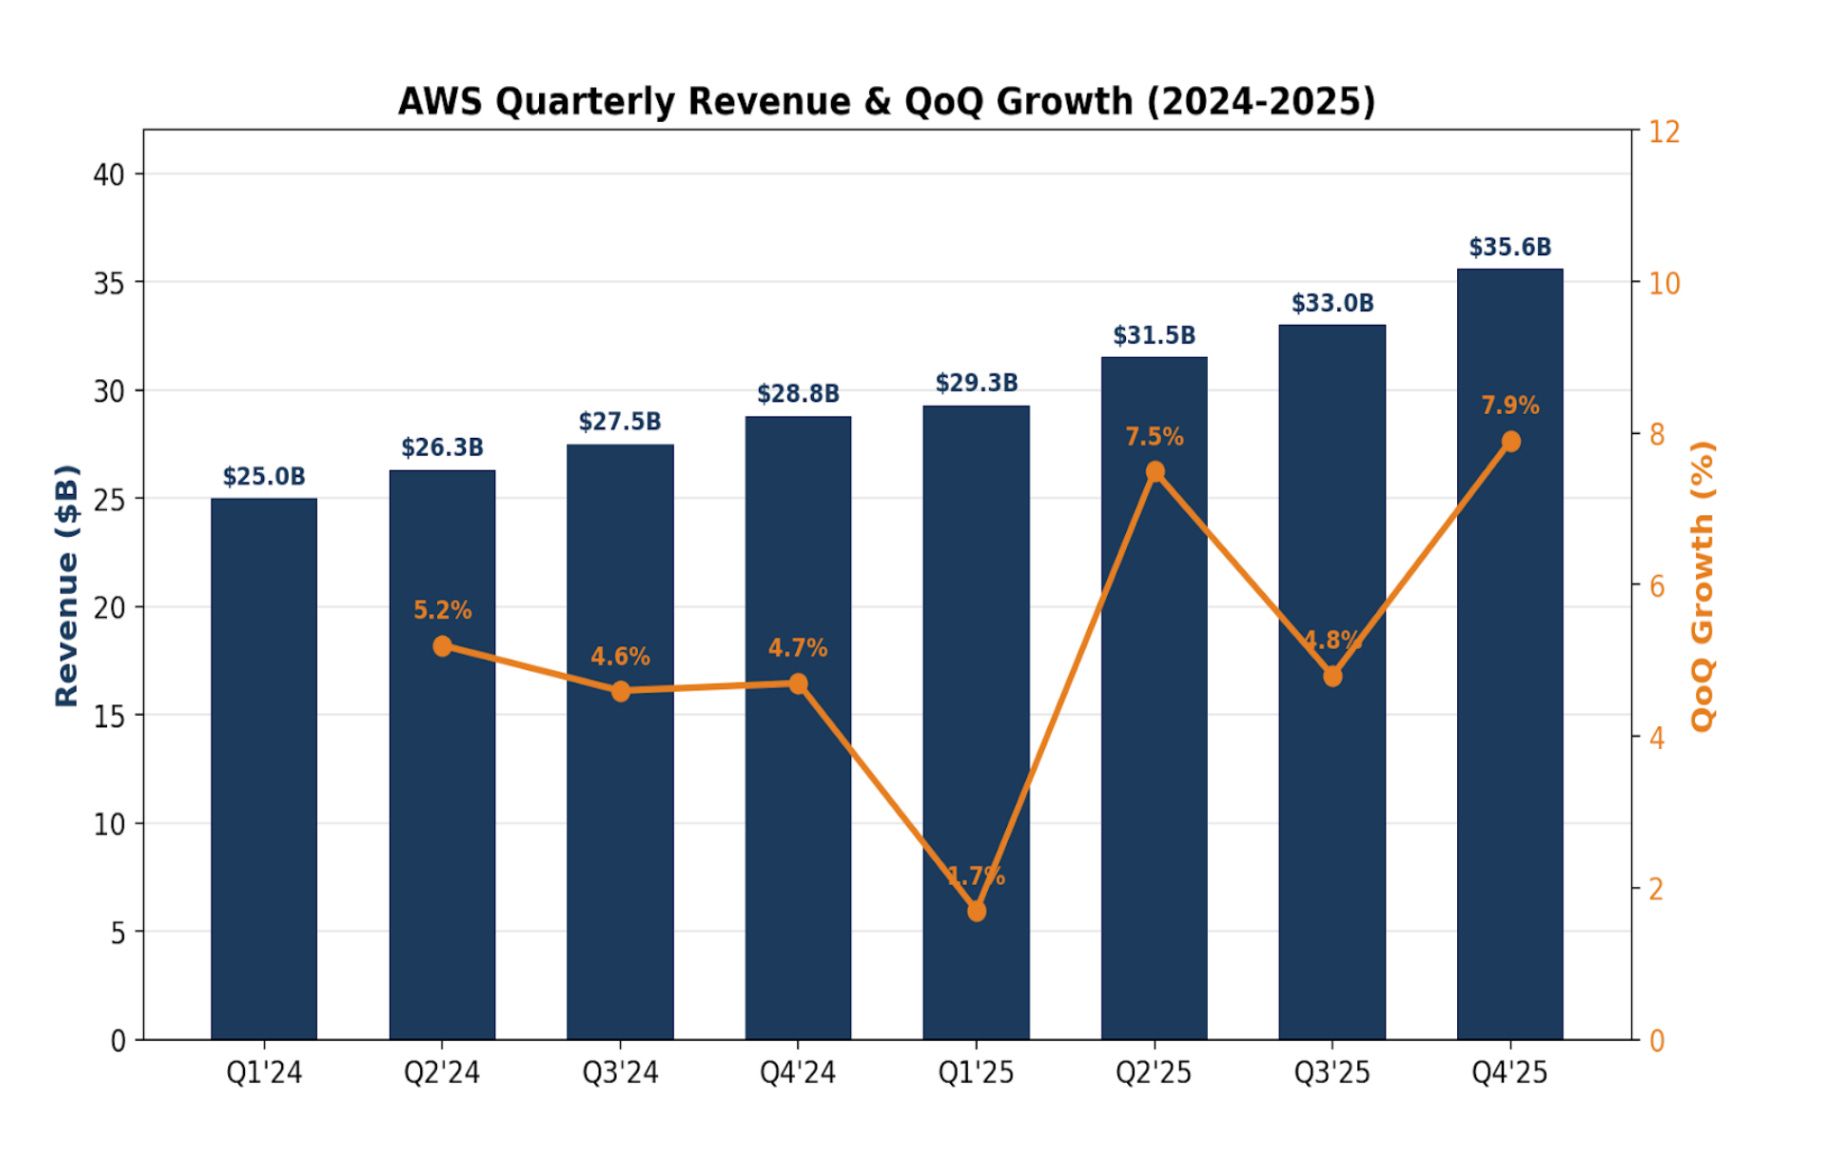
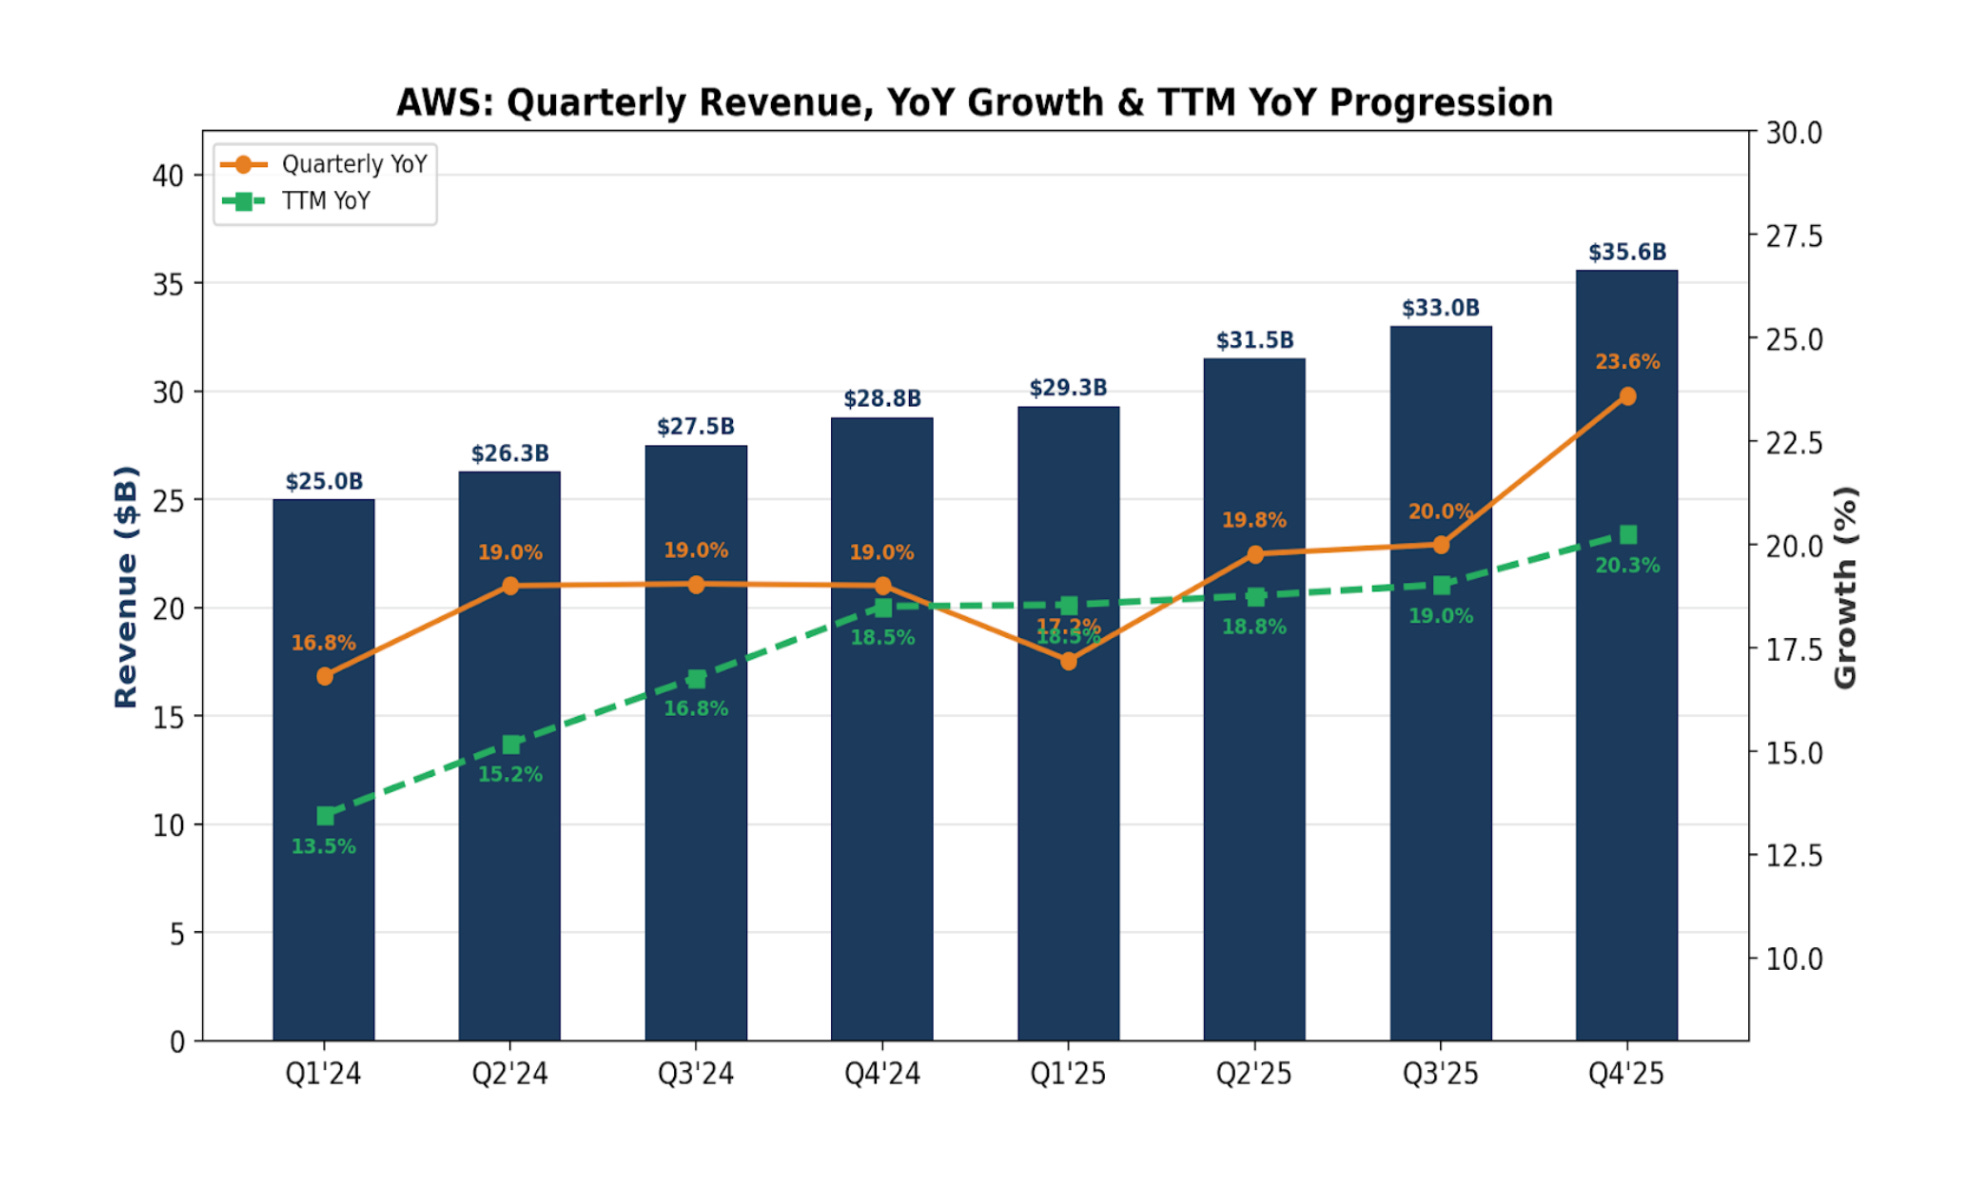
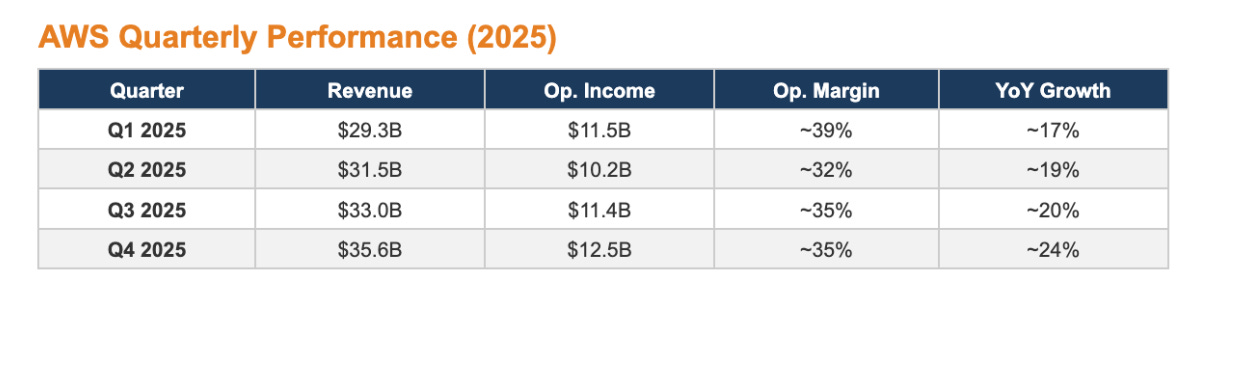
AWS generated $128.7 billion in revenue in FY2025, growing approximately 20% year-over-year, with growth accelerating to 24% in Q4 2025. More importantly, AWS produced $45.6 billion in operating income, roughly 57% of Amazon’s total operating profit, at an operating margin of approximately 35%.
The acceleration in Q4 is particularly significant. After decelerating through 2023 as enterprises optimized cloud spending, AWS returned to 20%+ growth in 2024 and continued to accelerate into 2025, driven by the generative AI infrastructure build-out. The $244 billion backlog, up 40% YoY and 22% quarter-over-quarter, provides exceptional revenue visibility.
2.2 AI as the Growth Catalyst
Generative AI is fundamentally reshaping the demand curve for cloud infrastructure. Amazon disclosed that its AI business is now generating multi-billion dollar quarterly revenue and growing at triple-digit rates. Every major AI lab, including Anthropic and OpenAI, runs significant workloads on AWS. The company’s Bedrock platform, which allows enterprises to access foundation models via API, is seeing rapid adoption.
AWS is uniquely positioned in the AI value chain: it provides the foundational compute layer (EC2, Trainium instances), the model-serving layer (Bedrock, SageMaker), and increasingly the application layer (Amazon Q, AI-enhanced developer tools). This vertical integration means AWS captures value at every level of the AI stack.
2.3 Key AI Customer Revenue Contributions
We can now quantify — with increasing precision — how much the major AI labs are contributing to AWS revenue. Barclays Research estimates that AWS's AI revenue will explode from $9.6 billion in 2025 to $31.6 billion in 2026 and $75.3 billion by 2028, reaching 29% of total AWS revenue. Anthropic and OpenAI alone are projected to account for nearly three-quarters of that total.
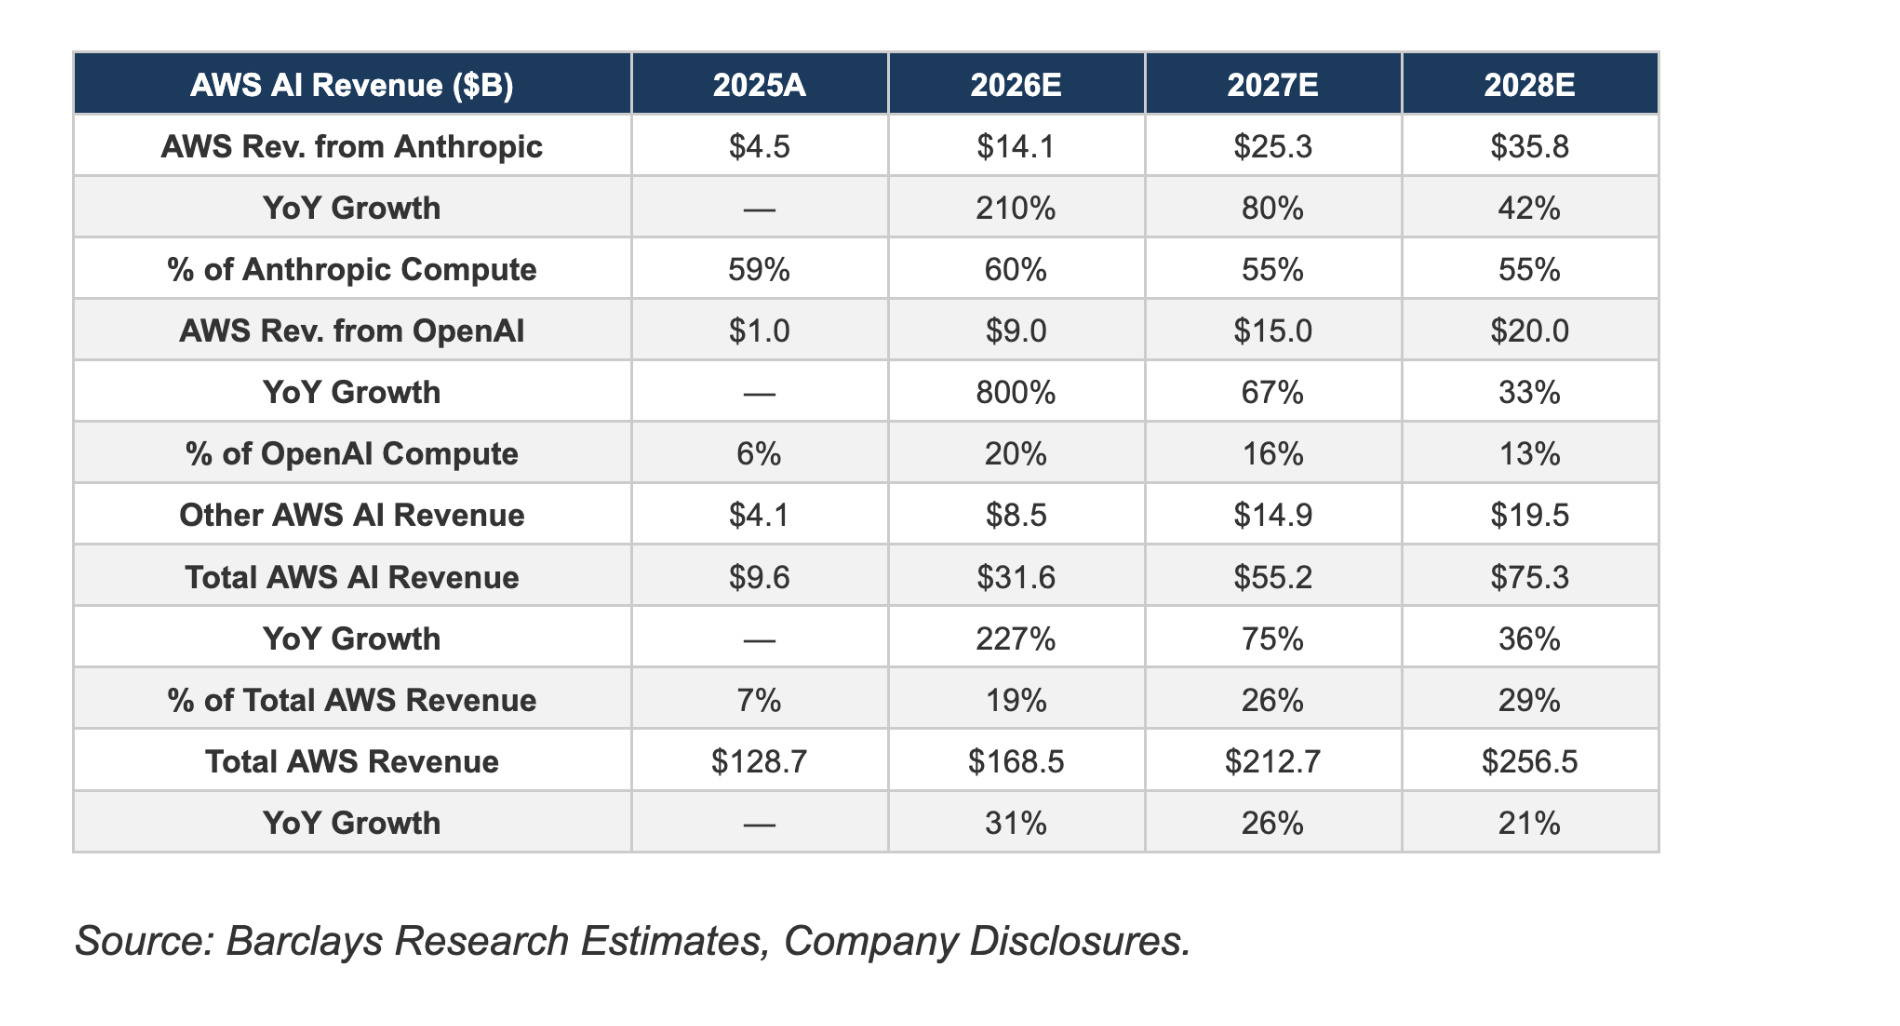
These numbers deserve emphasis. AI is not a secondary growth driver for AWS — it is becoming the growth driver. By 2028, nearly $1 of every $3 in AWS revenue will come directly from AI workloads, and the two largest AI labs alone will account for over $55 billion in combined AWS spending.
Anthropic is AWS’s most important customer and its growth trajectory is staggering. The company’s annualized revenue run rate surged from $19 billion in February 2026 to $30 billion by March 2026 — adding $11 billion in ARR in a single month. That kind of scaling is virtually unprecedented in enterprise software history. AWS captures approximately 55-60% of Anthropic’s total compute spend through its role as primary training partner (Project Rainier, Trainium infrastructure) and through Bedrock API reselling, where AWS takes roughly 50% of gross profits. Barclays projects AWS revenue from Anthropic will hit $14.1 billion in 2026 and $25.3 billion by 2027 — making Anthropic alone a top-5 AWS customer by revenue within the next 12 months.
Amazon’s $8 billion investment in Anthropic is now valued at approximately $60.6 billion following Anthropic’s $380 billion Series G in February 2026 — a 7.6x return that ranks among the most successful strategic investments in tech history. More importantly, the investment aligns incentives: Anthropic’s explosive growth flows directly into AWS revenue.
OpenAI signed its first AWS deal in November 2025 — a $38 billion, 7-year commitment to run workloads on AWS infrastructure using hundreds of thousands of Nvidia GPUs. In February 2026, the partnership was dramatically expanded: Amazon invested $50 billion in OpenAI and the companies announced an additional $100 billion in cloud commitments over 8 years, bringing the total to $138 billion. Barclays estimates AWS will capture $9 billion from OpenAI in 2026 alone — an 800% increase from the partial-year $1 billion in 2025 — growing to $15 billion by 2027 and $20 billion by 2028.
The AWS Backlog: A Leading Indicator — The contractual backlog tells the story in a single number. AWS’s remaining performance obligation reached $244 billion in Q4 2025, up 38% YoY. With the $100 billion OpenAI expansion factored in, Jefferies estimates the illustrative Q1 2026 backlog at approximately $344 billion — an 82% year-over-year increase. These are signed, contractual commitments that will convert to recognized revenue over the next 3-8 years, providing extraordinary forward visibility.
Uber announced in April 2026 that it is expanding its AWS relationship, migrating Trip Serving Zones to Graviton4 and piloting AI model training on Trainium3. At scale, Trainium3 runs at roughly 30-50% of the cost of comparable Nvidia H100/H200 hardware, making the economics compelling even before performance gains.
The takeaway: AI-driven revenue is set to be the dominant growth engine for AWS over the next three years, with Anthropic and OpenAI alone projected to contribute over $40 billion by 2027. The multi-year contractual commitments provide substantial downside protection, while the pace of Anthropic’s scaling — $11 billion in new ARR in a single month — suggests that even Barclays’ estimates may prove conservative.
2.4 Competitive Position
AWS maintains approximately 31-33% global cloud infrastructure market share, ahead of Microsoft Azure (~24%) and Google Cloud (~11%). While Azure has been gaining share, particularly in enterprise accounts tied to the Microsoft ecosystem, AWS retains the broadest service portfolio (240+ services), the largest global infrastructure footprint (34 regions), and the deepest integration with the developer community.
The key competitive risk is not displacement but rather share erosion as Azure and GCP invest aggressively. However, the $244 billion backlog and the stickiness of cloud migrations suggest that AWS’s absolute growth trajectory remains strong even if relative share tightens modestly.
2.5 Margin Dynamics
AWS operating margins have stabilized in the 33-35% range after the 2023 optimization cycle. Management has guided that margins should remain relatively stable despite the massive $200 billion 2026 capex program, implying that AI workloads carry comparable or better unit economics than traditional cloud workloads. The shift toward custom silicon (Graviton and Trainium) is a key margin lever, offering several hundred basis points of structural operating margin advantage versus reliance on third-party chips.
Critically, the capex cycle is expected to be self-funding. Morgan Stanley projects that AWS revenue growth will outpace capex spending from 2024-2027: $104.1 billion in incremental revenue versus $100.9 billion in incremental capex. In other words, every dollar of new investment is generating slightly more than a dollar of new revenue, before accounting for the margin on that revenue. This is a critical data point for bulls: it implies AWS is not destroying value through overinvestment, but rather investing at returns that exceed its cost of capital.
3. Advertising: The Hidden Margin Machine
3.1 Current Performance
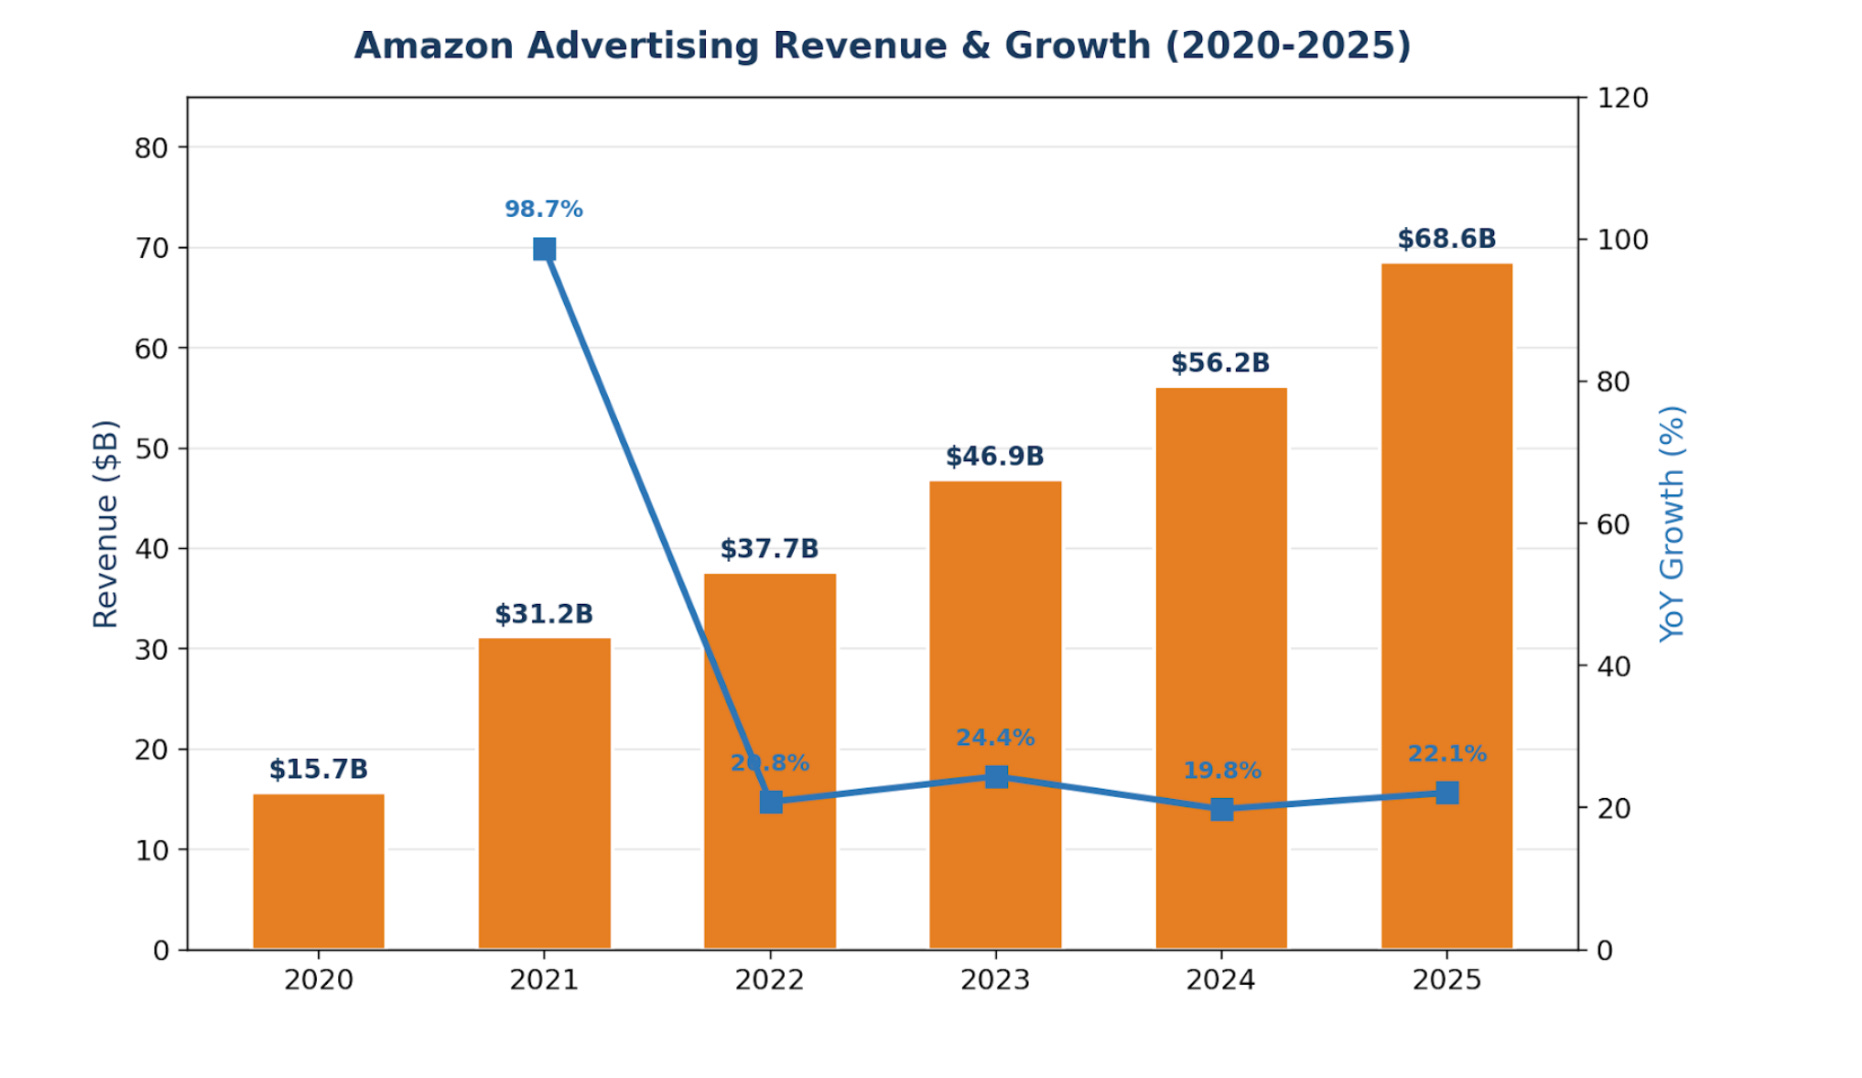
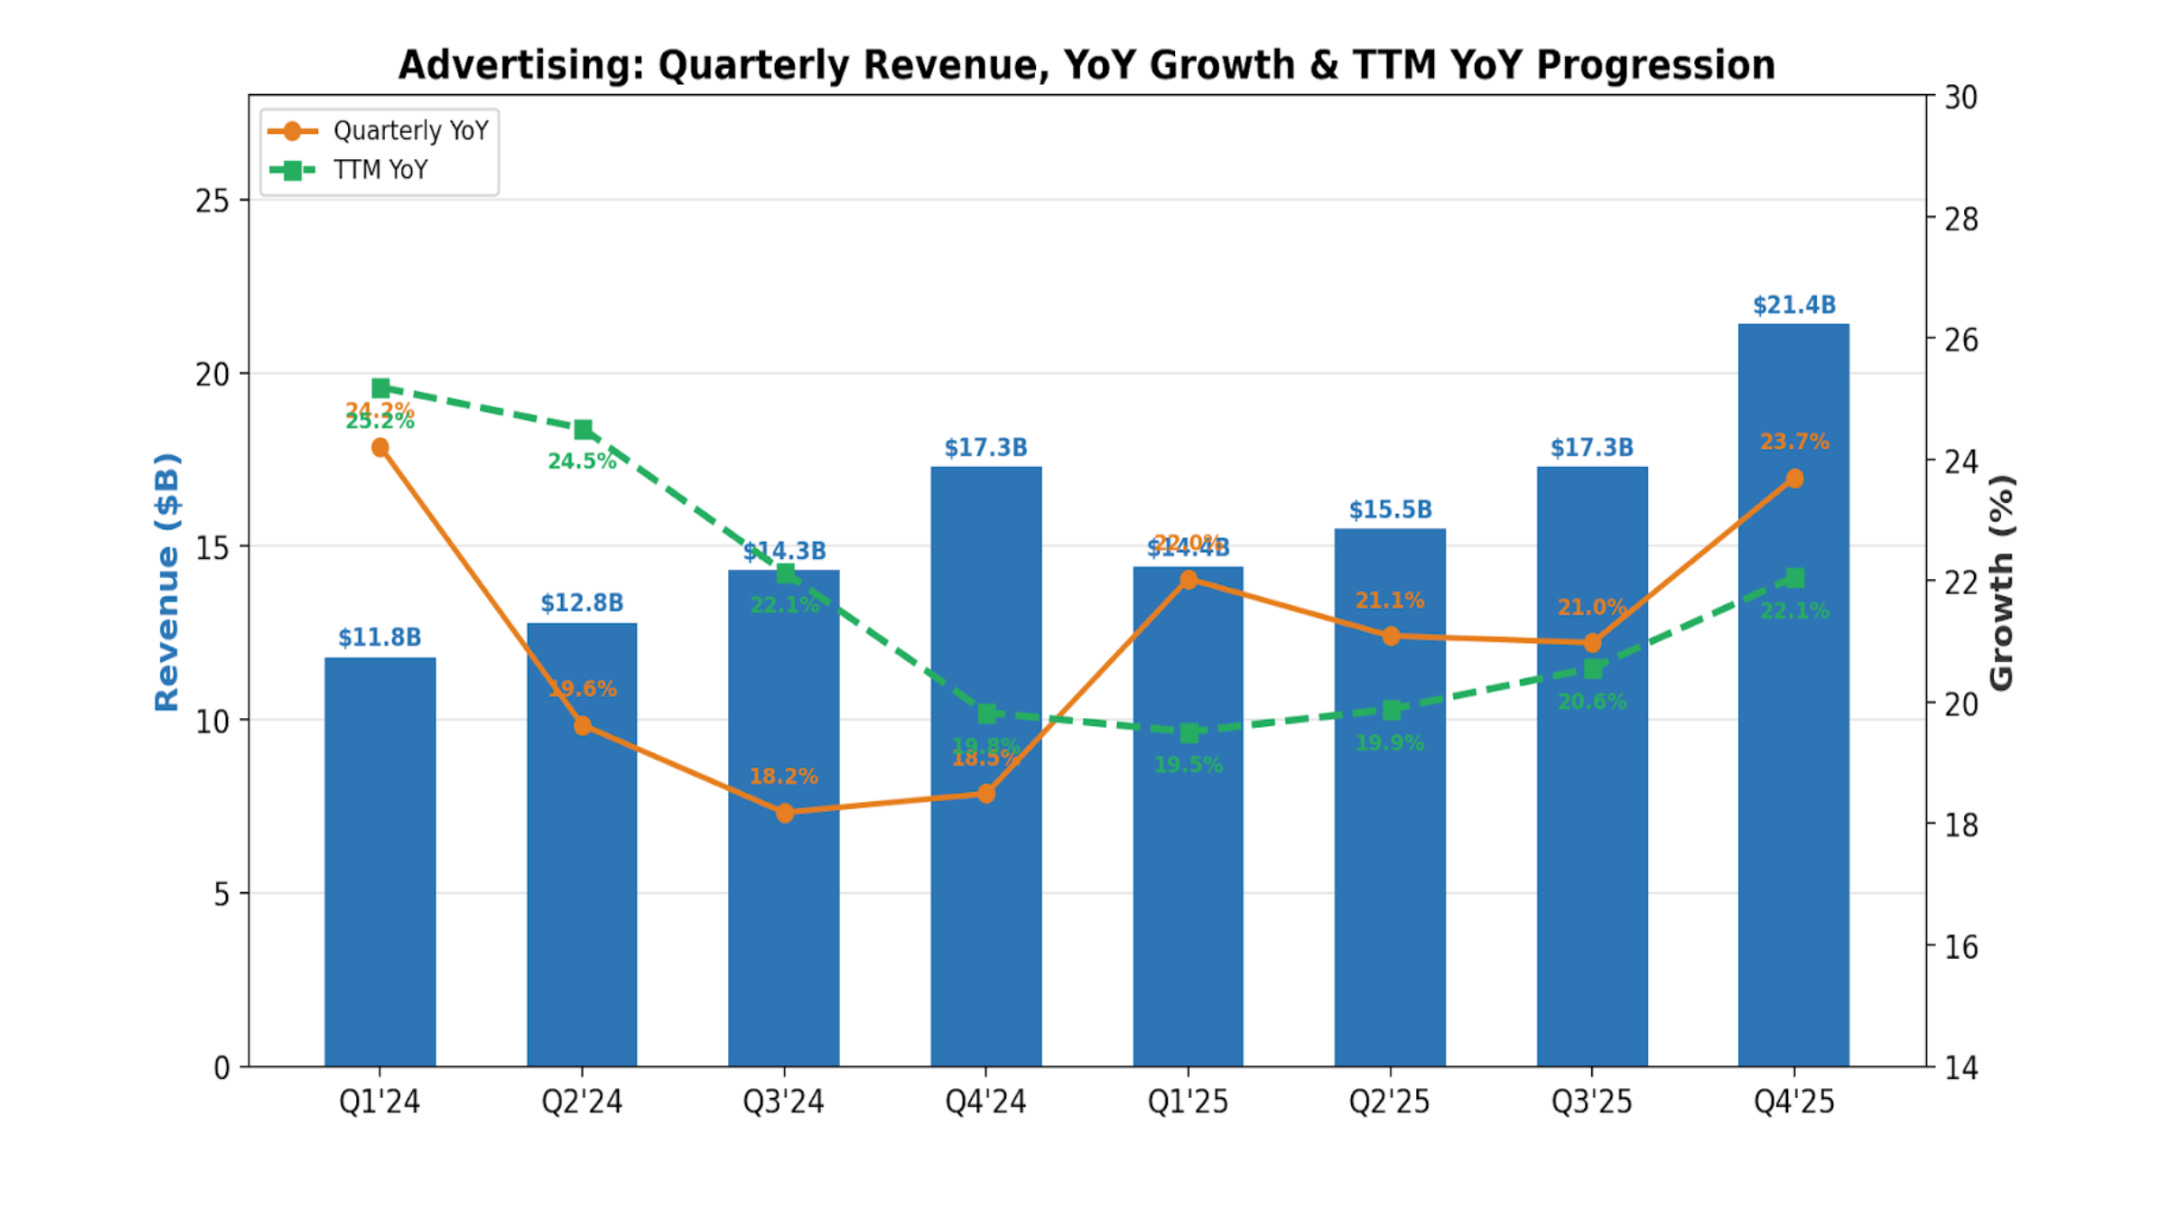
Amazon’s advertising business generated $68.6 billion in 2025, growing 22% year-over-year and cementing Amazon as the third-largest digital advertising platform globally behind Google and Meta. Advertising now represents nearly 10% of total revenue but contributes a disproportionate share of profitability given its estimated 50-70% operating margins.
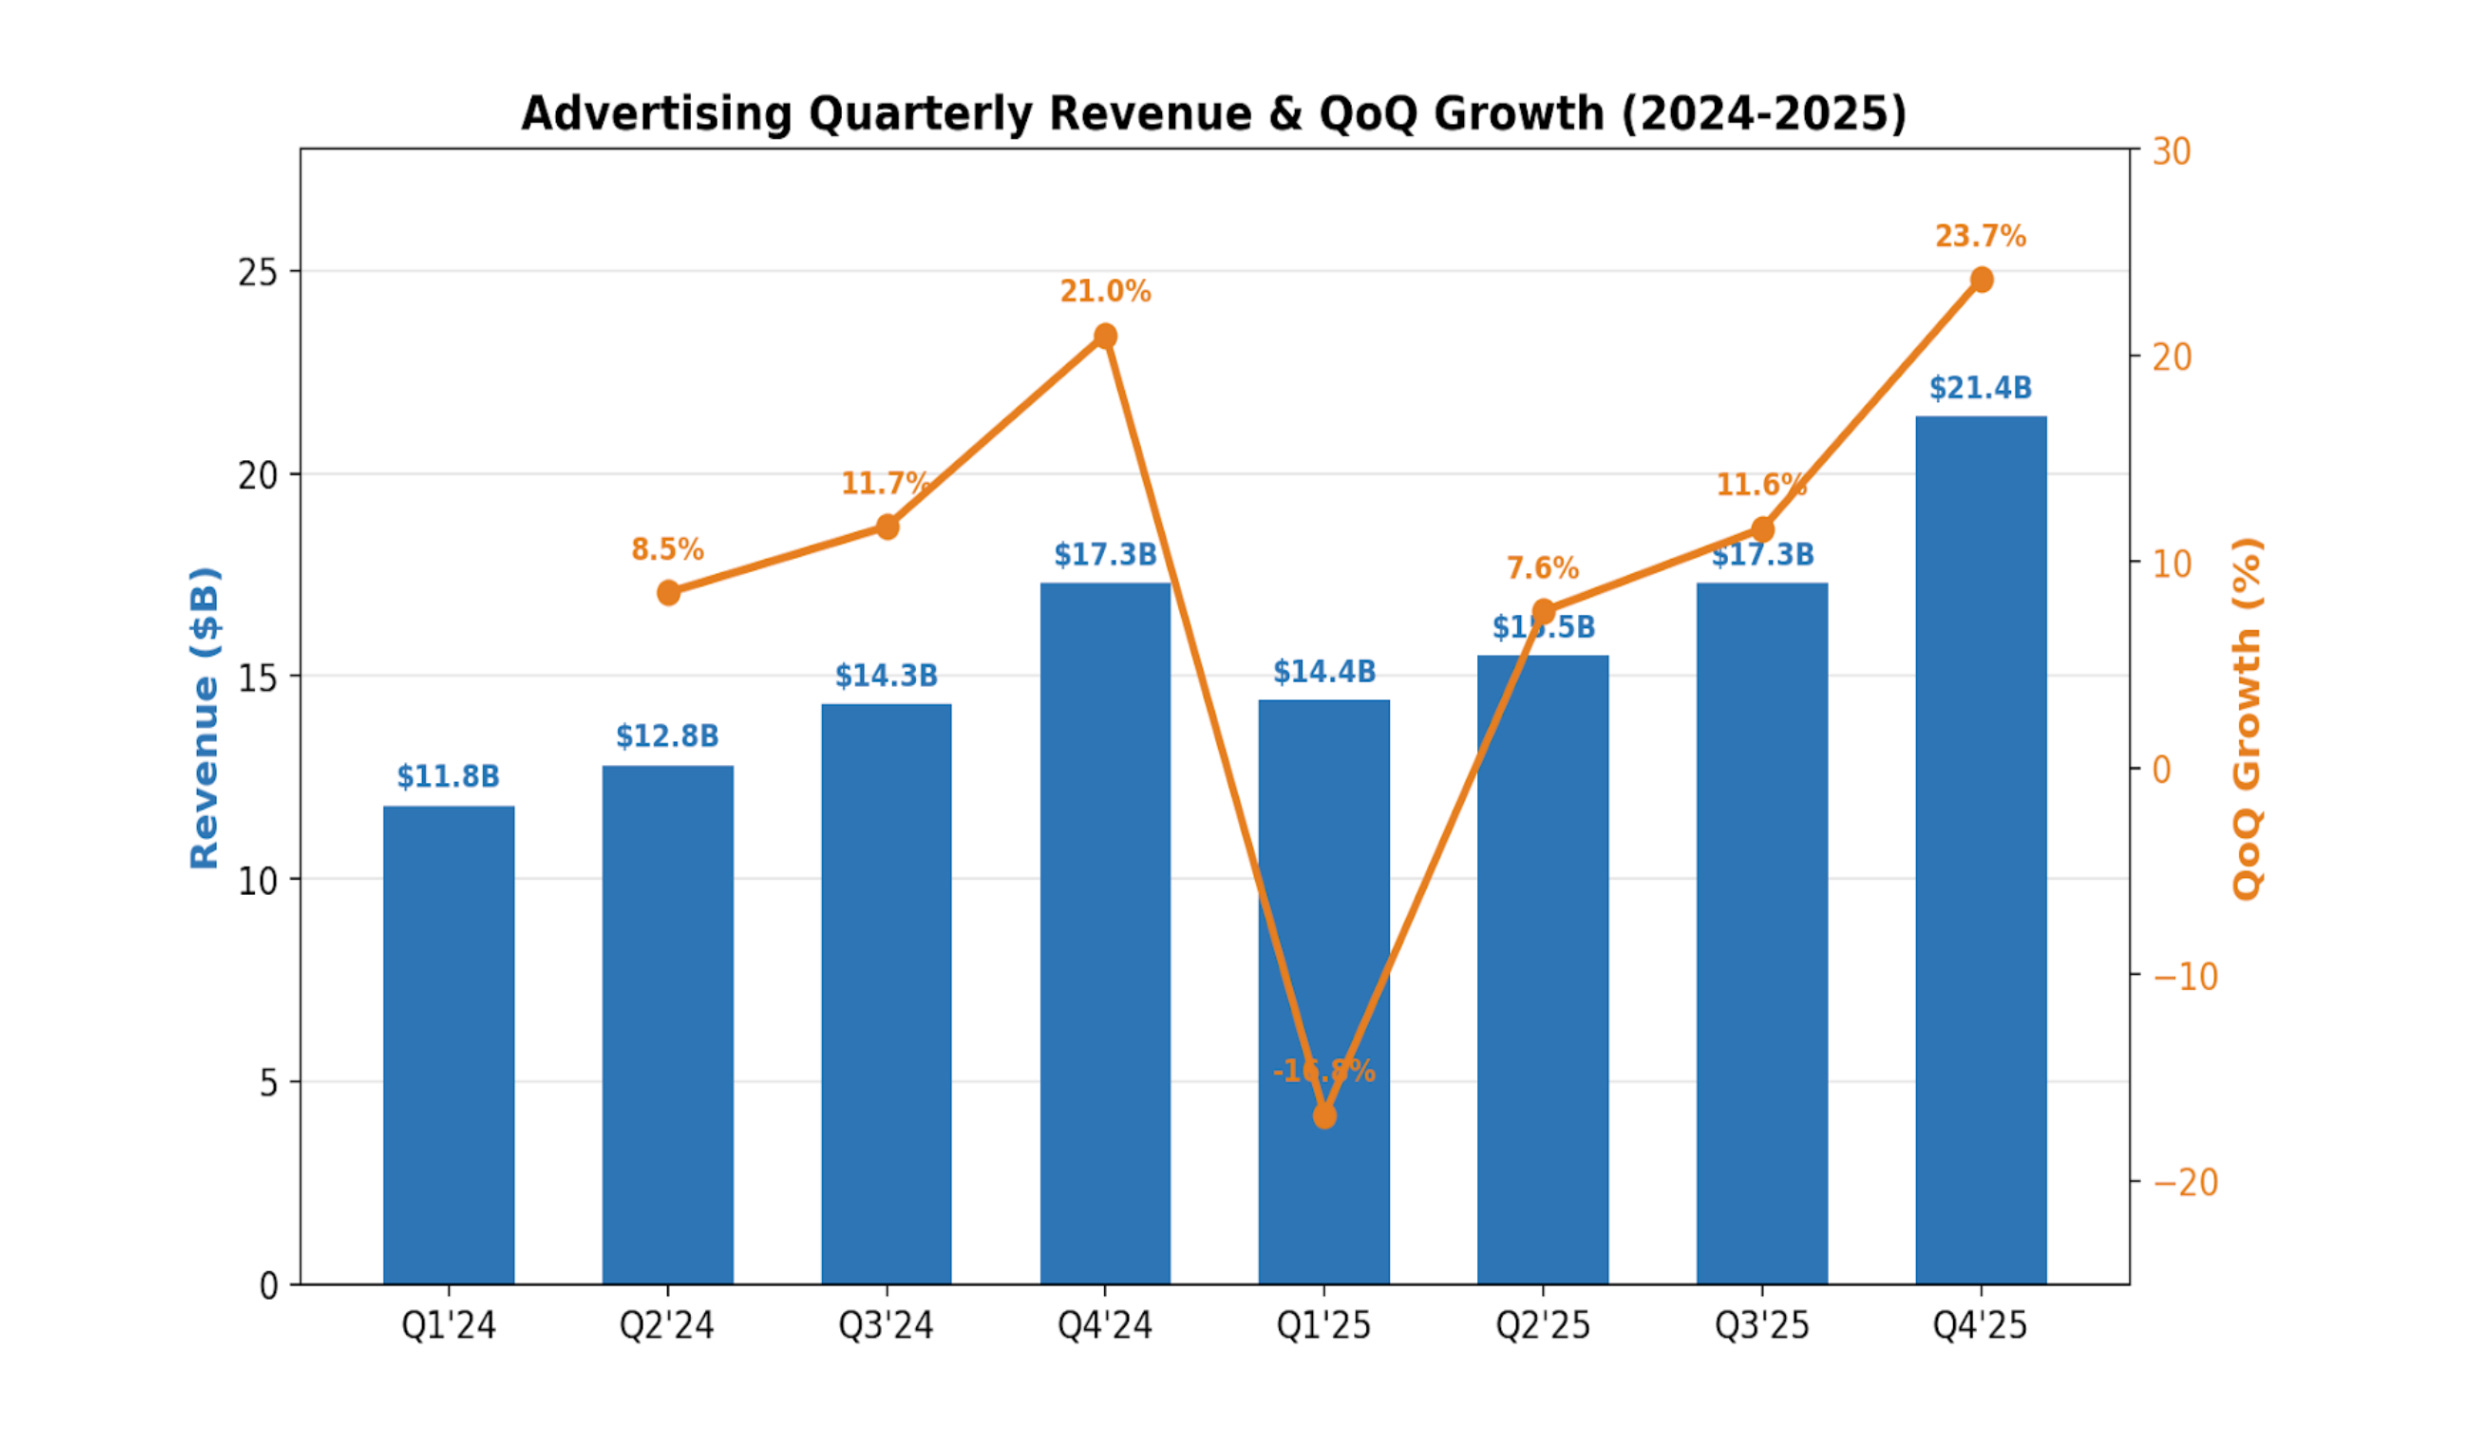
To appreciate the trajectory: Amazon’s ad revenue was $31 billion as recently as 2022. In just three years, the business has more than doubled. Quarterly revenue hit $17.3 billion in Q4 2025, and Q1 2026 came in at approximately $14.6 billion (up 19% YoY), suggesting sustained momentum even against tougher comparisons.
3.2 Why Amazon Ads Are Uniquely
Amazon’s advertising platform benefits from a structural advantage no competitor can replicate: closed-loop purchase data. When a consumer searches for “running shoes” on Amazon, the platform knows not only what they searched for but what they bought, what they browsed, their purchase history, and their spending patterns. This allows advertisers to measure return on ad spend (ROAS) with far greater precision than Google or Meta, where the link between ad impression and purchase is probabilistic rather than deterministic.
Sponsored Products remain the core format, but Amazon has been rapidly expanding into: Sponsored Brands, Display Ads (DSP), Streaming TV ads (Prime Video and Twitch), and programmatic advertising across Amazon’s broader properties. The introduction of ads on Prime Video in January 2024 opened a massive new inventory pool, with 315+ million ad-supported viewers globally by early 2026.
3.3 Prime Video Advertising: The Next Growth Vector
The Prime Video ad-tier is still in its early innings. Cost Per Mille (CPM), the price an advertiser pays per 1,000 ad impressions, has risen to premium-streamer parity on Prime Video, topping Netflix CPMs for the first time in Q4 2025. This reflects growing advertiser demand and validates the quality of Prime Video’s audience. The ad-tier is estimated to add $2-3 billion in annual revenue currently, but this figure could scale dramatically as Amazon builds out its ad-tech stack for streaming and expands internationally.
Amazon spent $22.4 billion on content in 2025, up 10%. Unlike Netflix, Amazon can monetize content spending across multiple revenue streams: it drives Prime subscriptions, Prime Video ad revenue, and increases overall time spent in the Amazon ecosystem, which in turn drives retail purchases. This makes Amazon’s content ROI fundamentally different from pure-play streamers.
3.4 Margin Profile
Amazon does not break out advertising operating income separately, but industry analysts estimate operating margins in the 50-70% range. The business is built on top of Amazon's existing e-commerce infrastructure, meaning incremental ad revenue drops through with minimal incremental cost. As the mix shifts toward higher-CPM streaming ads and programmatic display, margins could expand further. We conservatively model 55-60% operating margins for the ads segment.
4. Third-Party Seller Services: The Toll Booth
4.1 Current Performance
Third-Party Seller Services generated $140.1 billion in FY2025, growing approximately 13% year-over-year. This segment includes referral fees, Fulfillment by Amazon (FBA) fees, shipping fees, and other seller services. Third-party sellers now account for over 62% of all units sold on Amazon, up from 58% just two years ago.
4.2 The Take Rate Story
Amazon’s effective take rate on third-party sales has risen steadily, from approximately 33% in 2016 to an estimated 45-50% in 2025 when advertising spend by sellers is included. Pure marketplace fees (referral + FBA) average 28-32%. While this has generated criticism and regulatory scrutiny, sellers continue to flock to the platform because Amazon provides unmatched access to 300+ million active customers and handles logistics through the most sophisticated fulfillment network ever built.
Critically, much of the take rate expansion comes from advertising. Sellers increasingly must purchase Sponsored Products to maintain visibility, effectively converting marketing spend into Amazon’s advertising revenue. This means the 3P Seller Services and Advertising segments are deeply intertwined, with the total seller ecosystem generating roughly $200+ billion combined.
4.3 Buy With Prime and Supply Chain by Amazon
Amazon is extending its logistics and payments infrastructure beyond Amazon.com through Buy With Prime, which lets sellers offer Prime-level shipping on their own websites, and Supply Chain by Amazon, an end-to-end logistics solution. These initiatives convert Amazon's massive logistics investment into a third-party service, creating a new addressable market beyond the Amazon marketplace.
4.4 Margin Profile
Third-Party Seller Services margins are difficult to isolate because FBA costs are shared with Amazon's own retail operations. However, referral fees are essentially pure margin, and FBA fees are priced to be profitable after covering fulfillment costs. We estimate segment operating margins of 20-25%, with potential for gradual expansion as logistics efficiency improves and higher-margin services (advertising, lending) grow within the seller ecosystem.
5. Subscription Services: The Recurring Revenue Anchor
5.1 Current Performance
Subscription services generated approximately $44.4 billion in FY2025, growing roughly 11% year-over-year. This segment includes Amazon Prime memberships, Kindle Unlimited, Audible, Amazon Music, and other subscription offerings. Amazon Prime remains the dominant driver, with an estimated 240+ million global subscribers and approximately 201 million U.S. members.
5.2 The Prime Flywheel
Prime is the most powerful consumer subscription in the world because it bundles disparate services into a single value proposition that becomes more valuable as Amazon adds features. A Prime membership now includes free 1-2 day shipping, Prime Video (with ads), Prime Music, Prime Reading, Prime Gaming, exclusive deals, and grocery delivery benefits. The annual price ($139 in the U.S.) represents extraordinary value given the breadth of benefits.
Prime members spend an estimated 2-3x more than non-Prime customers on Amazon, making the subscription a powerful driver of retail revenue, advertising impressions, and third-party seller activity. The introduction of Prime Video ads in 2024 added a new monetization layer: members either watch ads (generating ad revenue) or pay an additional $2.99/month for ad-free viewing (additional subscription revenue).
5.3 Growth Drivers
Subscription growth is driven by: continued international expansion (particularly in India, Brazil, and Southeast Asia), price increases (the U.S. price has risen from $99 to $139 over the past decade and could move higher), new bundled services, and the Prime Video ad-tier upsell. Amazon is also expanding healthcare subscriptions through Amazon One Medical and Amazon Pharmacy, which could become meaningful contributors.
5.4 Margin Profile
Subscription margins are complex. Prime Video content spending ($22.4B in 2025) is a significant cost, but the subscription also drives retail purchases, ad revenue, and ecosystem lock-in. On a standalone basis, we estimate subscription operating margins of 15-20%, but the true margin contribution is substantially higher when considering the flywheel effects across Amazon's other segments.
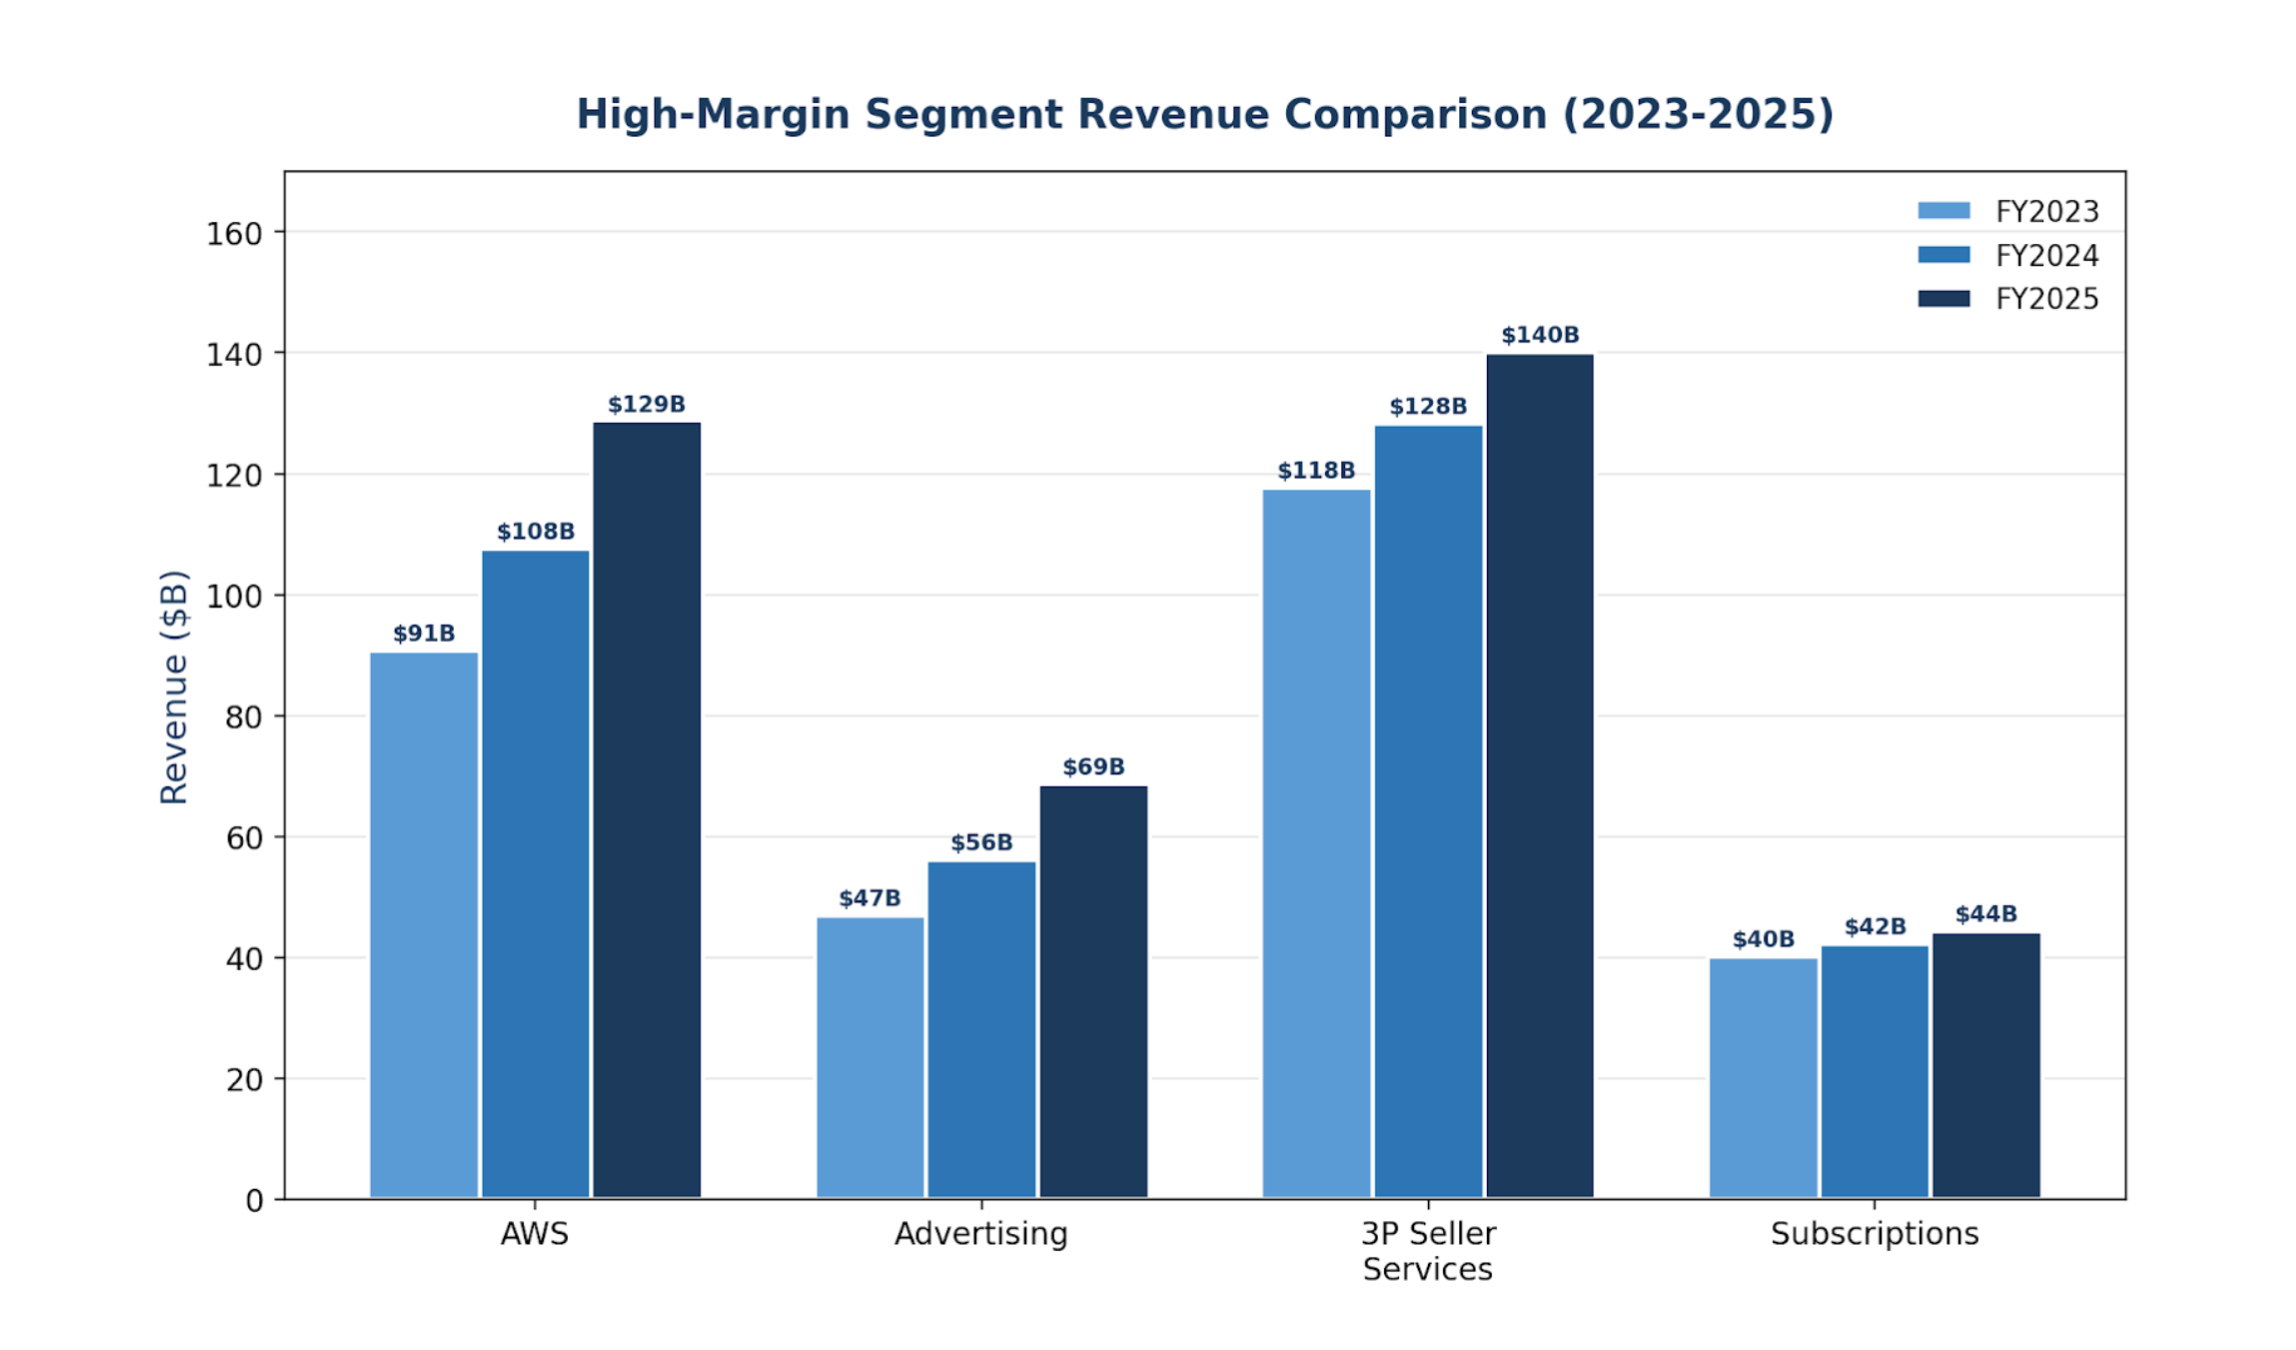
5.5 High-Margin Segment Revenue Comparison (2023-2025)
6. Amazon’s Custom Silicon: The Strategic Weapon
6.1 The Three-Chip Strategy
Amazon’s custom silicon program, the most ambitious in-house chip effort outside of Apple, spans three product lines that together form a vertically integrated computing stack:
Graviton (Custom CPUs): Now in its fourth generation, Graviton delivers 40%+ better price-performance than comparable x86 processors. Adoption is extraordinary: 98% of the top 1,000 EC2 customers use Graviton, and demand is so strong that two large AWS customers asked to reserve all available Graviton capacity for 2026.
Trainium (AI Accelerators): This is Amazon’s most strategically important chip. Trainium2, which shipped in 2025, offers approximately 30% better price-performance than comparable GPU alternatives and is largely sold out. Trainium3 began shipping in early 2026, delivering a further 30-40% improvement over Trainium2. Anthropic and OpenAI are confirmed Trainium3 users for both training and inference workloads.
Nitro (Infrastructure Chips): Nitro offloads hypervisor, storage, and networking functions from the main CPU, reducing overhead and improving security. It is the foundation that enables both Graviton and Trainium to deliver their performance advantages.
6.2 Financial Impact
In his April 2026 shareholder letter, CEO Andy Jassy stated that Amazon’s custom chip business generates more than $20 billion in annualized revenue growing at triple-digit rates. He estimated that if the chip business were sold on the open market like Nvidia, it would be worth roughly $50 billion a year.
The financial implications are profound. Amazon expects Trainium to save tens of billions of capex dollars per year compared to purchasing equivalent third-party chips. More importantly, custom silicon provides several hundred basis points of operating margin advantage for AI inference workloads, which are growing exponentially as AI applications scale.
6.3 Competitive Implications
Google (TPUs) and Microsoft (Maia) are pursuing similar custom silicon strategies, but Amazon appears to be furthest ahead in terms of commercial scale and customer adoption. The Trainium ecosystem is particularly compelling: AWS has built the Neuron SDK, provided pre-optimized model libraries, and signed marquee customers (Anthropic, OpenAI, Apple, Uber) that validate the platform.
The chip business also creates a powerful lock-in mechanism. Once customers optimize their workloads for Trainium, switching to another platform requires re-engineering their inference pipeline. This increases the stickiness of AWS relationships and provides pricing power as AI workloads grow.
7. Financial Projections: 2026-2031
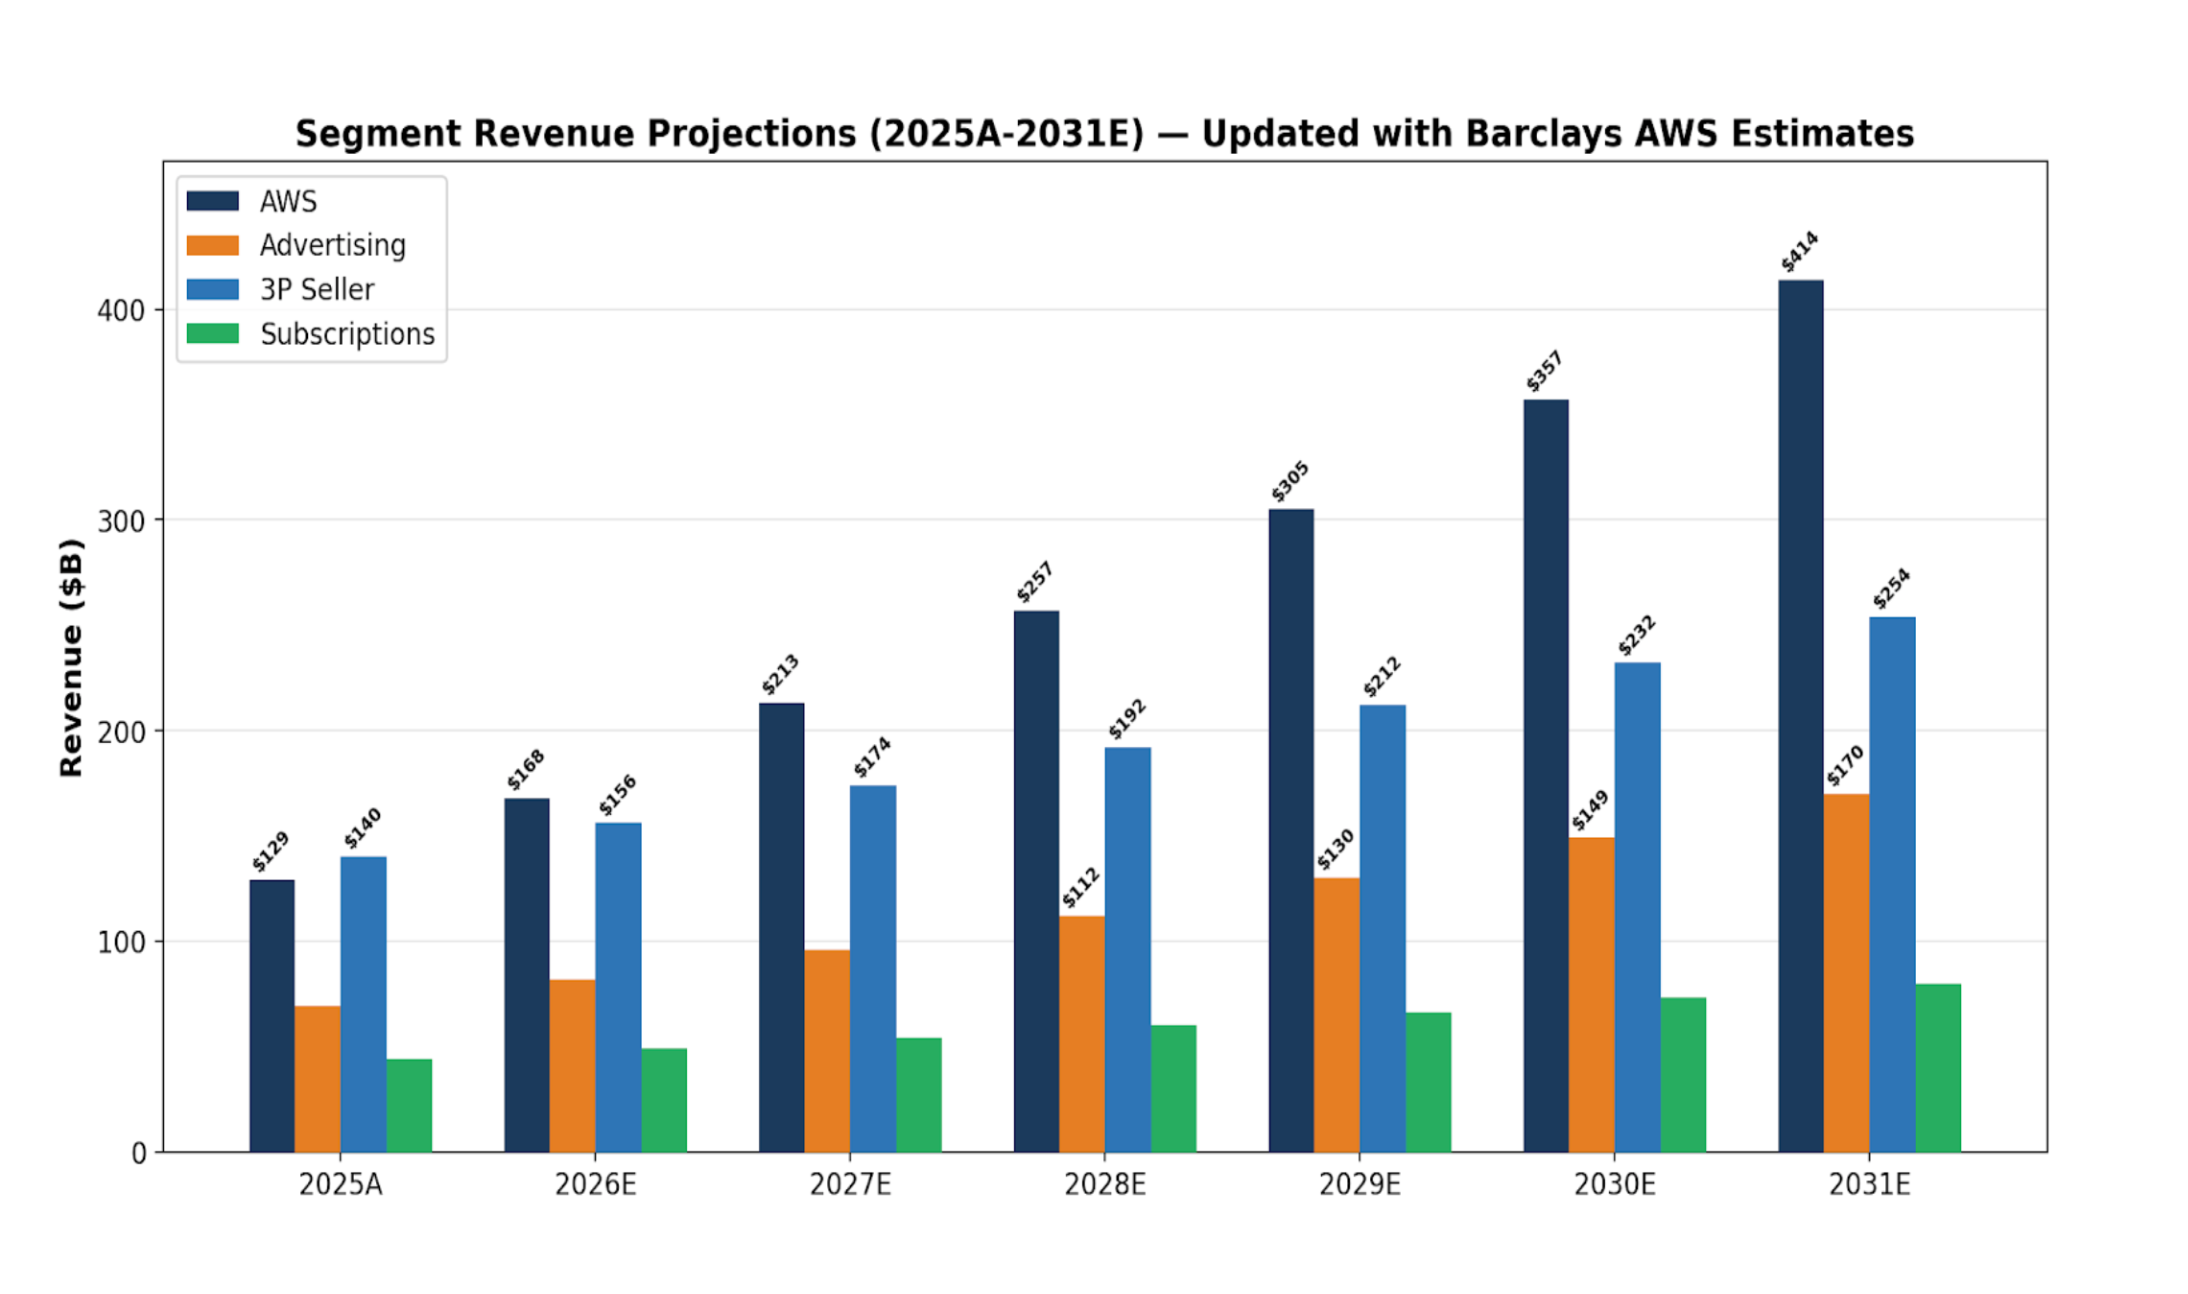
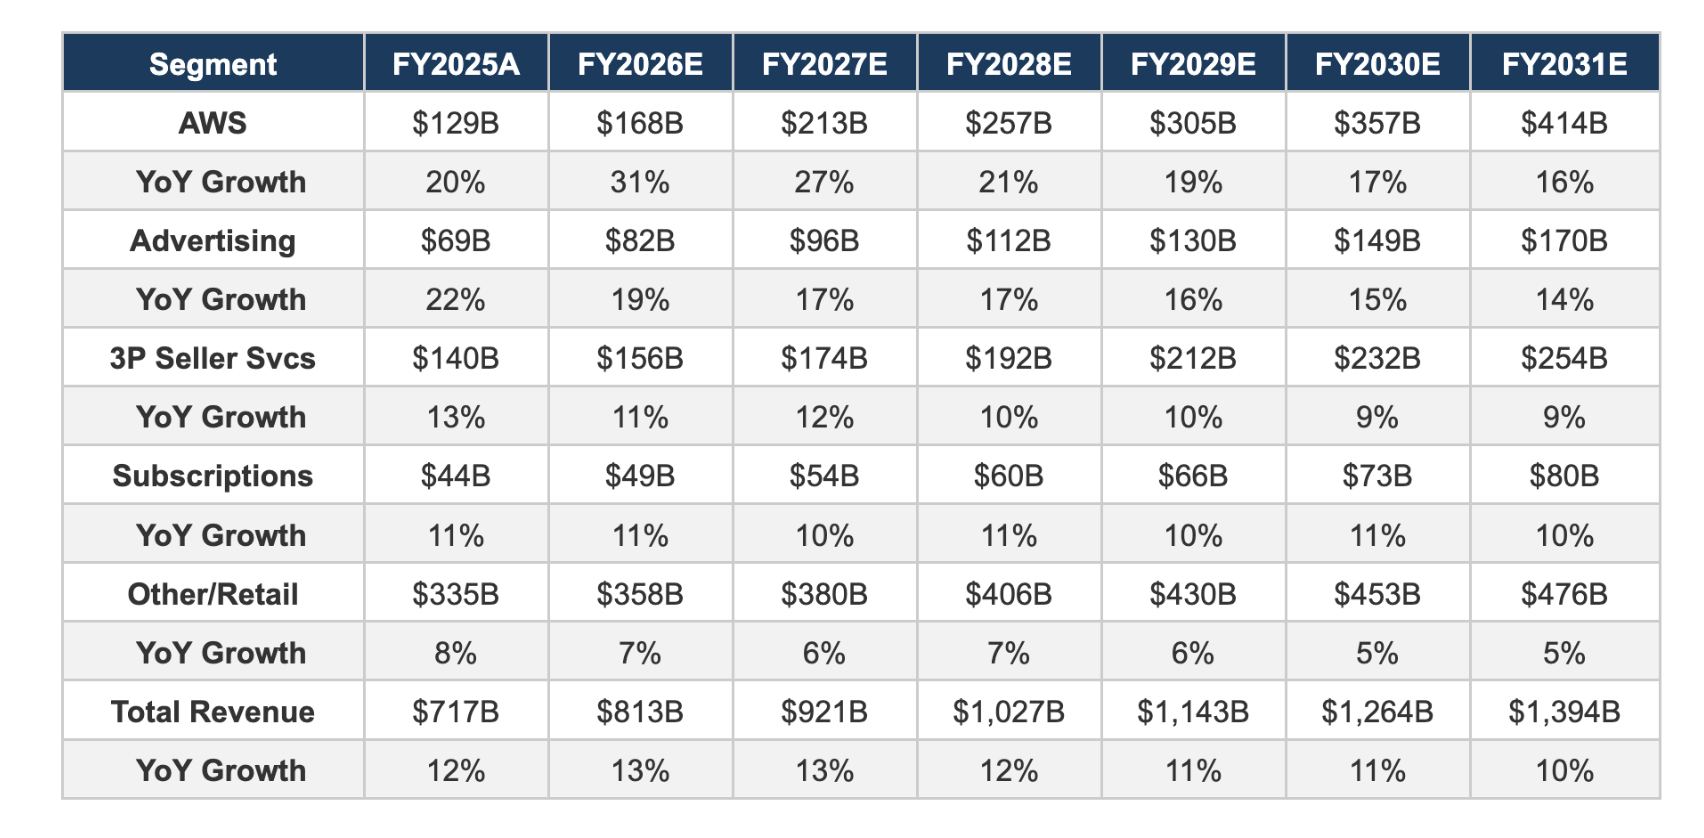
7.1 Segment Revenue Projections
Our base-case projections reflect a bullish but grounded view of AWS driven by the accelerating AI infrastructure cycle. With a $244 billion backlog growing 40% YoY, Trainium3 nearly fully subscribed, and every major AI lab building on AWS, we model AWS sustaining 20%+ growth through 2027 before moderating to the high-teens. Advertising sustains 15-19% growth as Prime Video ads scale. Third-Party Seller Services grows at 9-12% as the marketplace matures. Subscriptions grow at 10-11%.
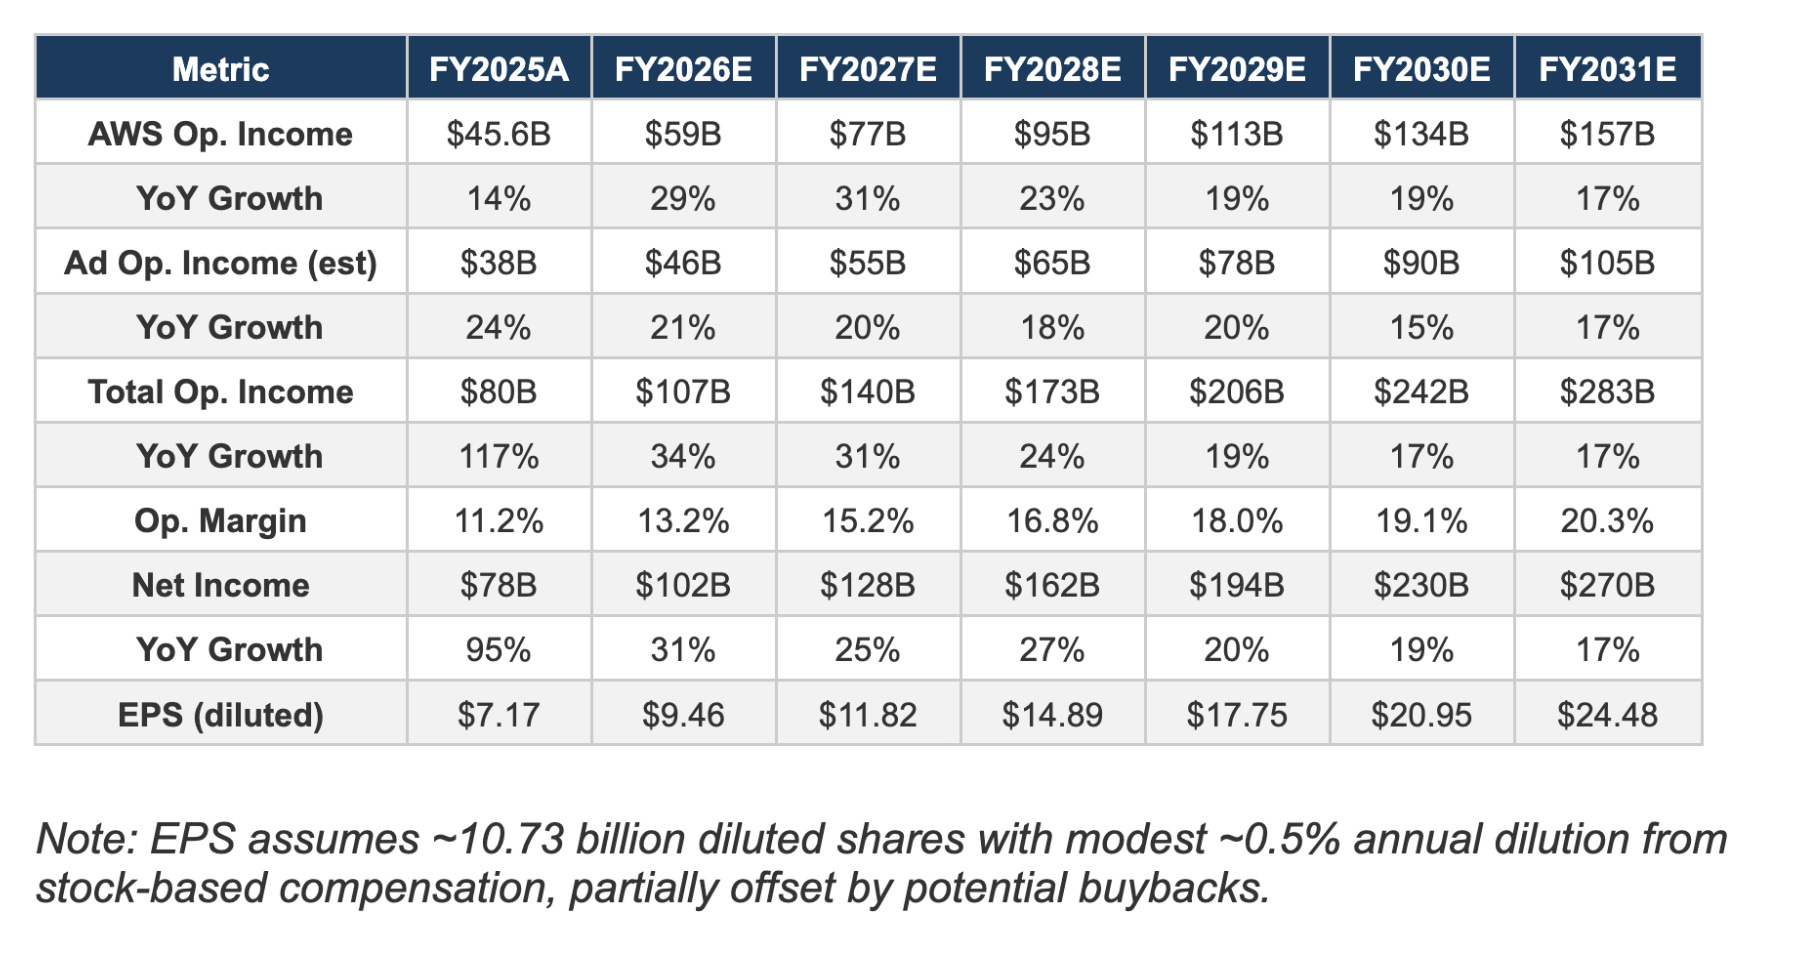
7.2 Operating Income Projections
Operating income growth outpaces revenue growth as the business mix shifts toward higher-margin segments. AWS margins expand from 35% to 38% as custom silicon scales. Advertising operating margins reach 62% by 2031. The consolidated operating margin expands from ~11% in 2025 to a projected 20% by 2031.
8. Valuation: Discounted Cash Flow (DCF) Model
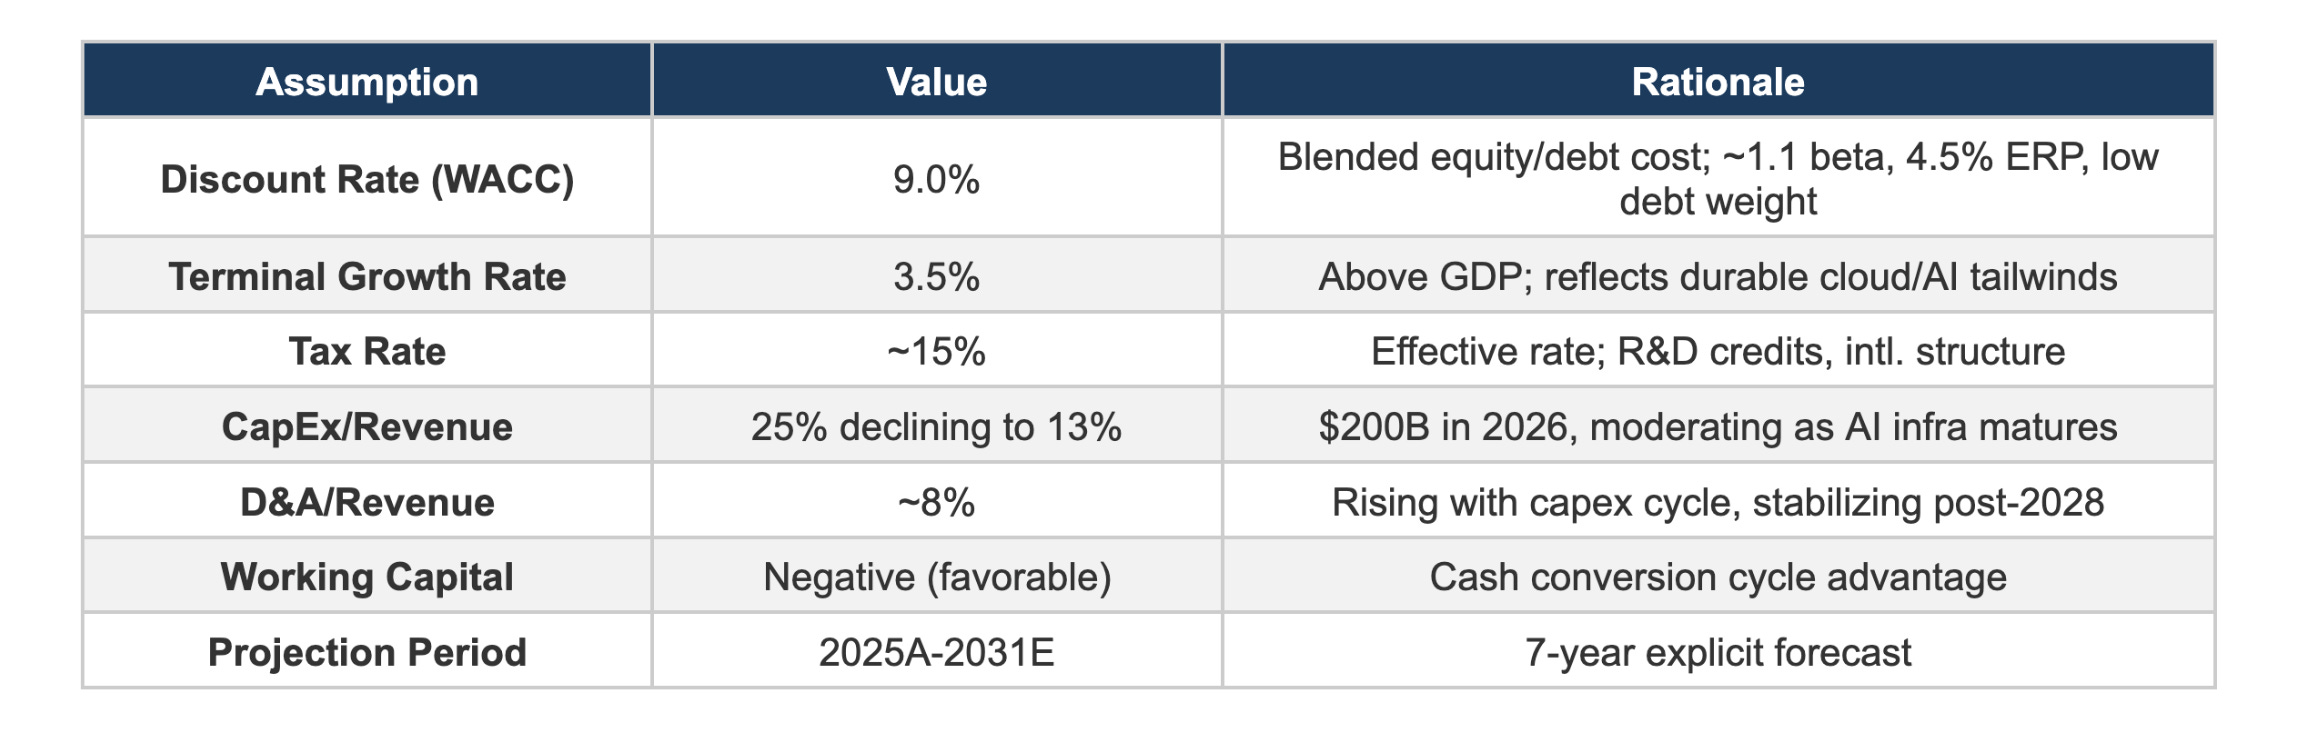
8.1 Key Assumptions
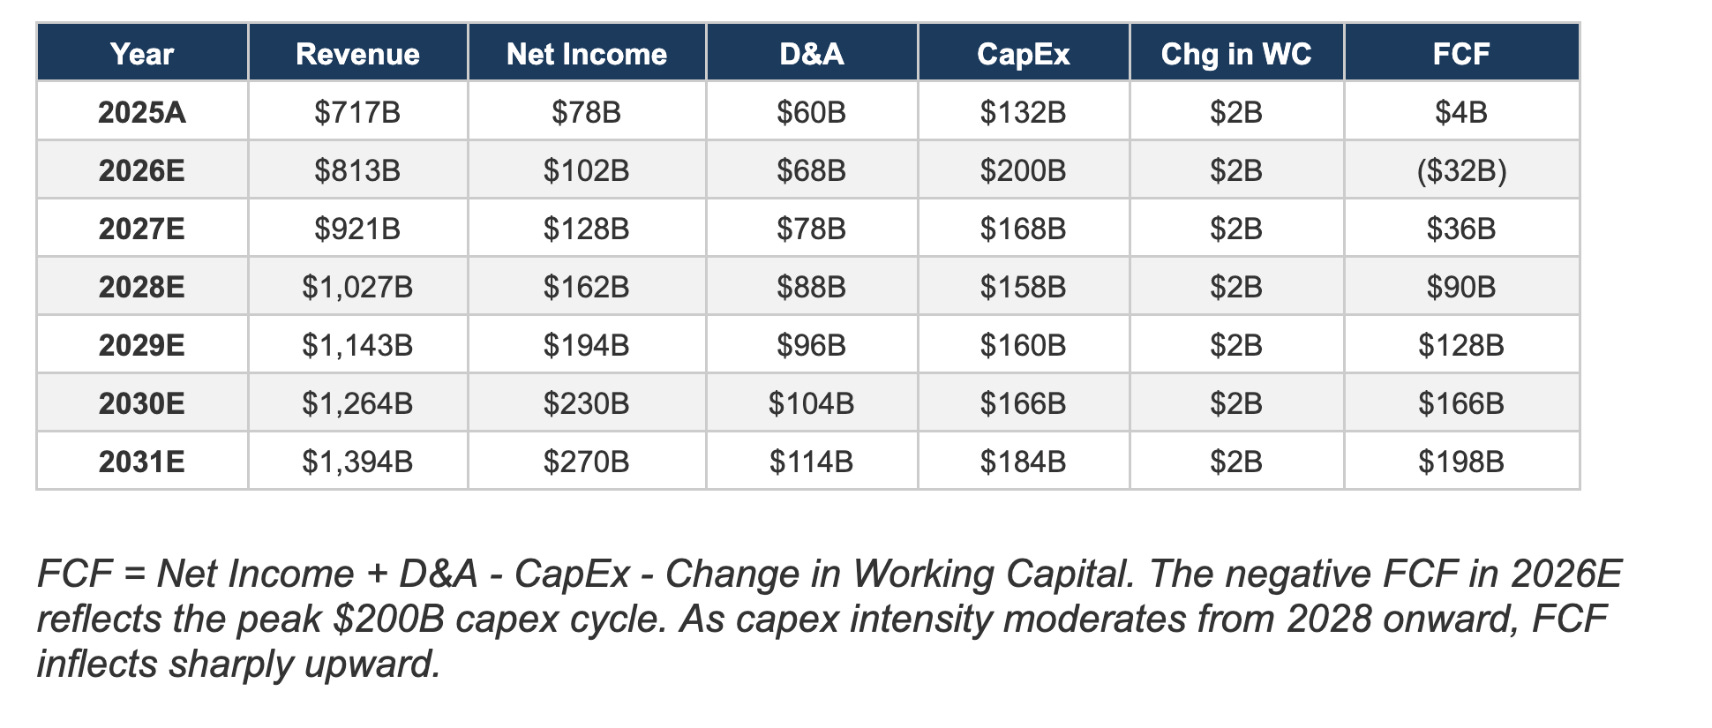
8.2 Free Cash Flow Projections
8.3 DCF Results
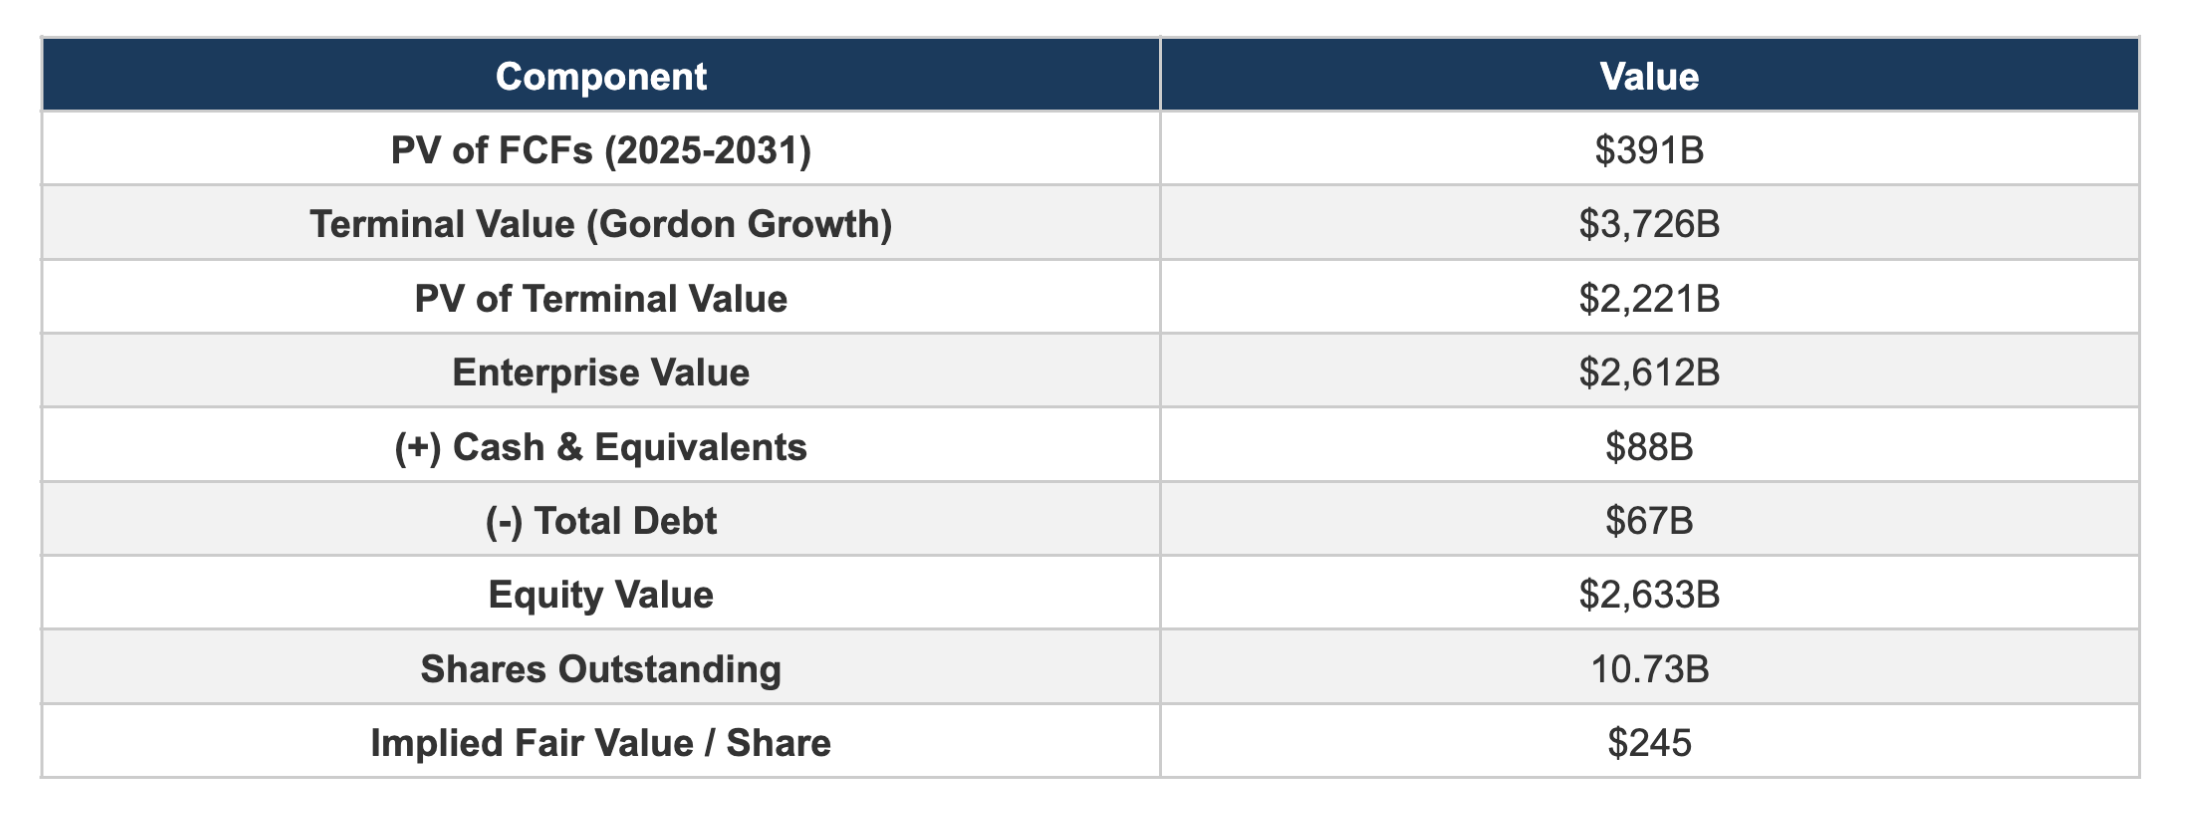
Our base-case DCF yields an implied fair value of approximately $245 per share, roughly 3% above the current trading price of ~$238. The model reflects the Barclays AWS revenue trajectory and the resulting acceleration in operating income and free cash flow. At today’s price, the stock is approximately fairly valued under base-case assumptions, but with substantial asymmetric upside if AI monetization tracks the bull case — which Anthropic’s $11 billion single-month ARR jump and the $344 billion illustrative backlog increasingly support.
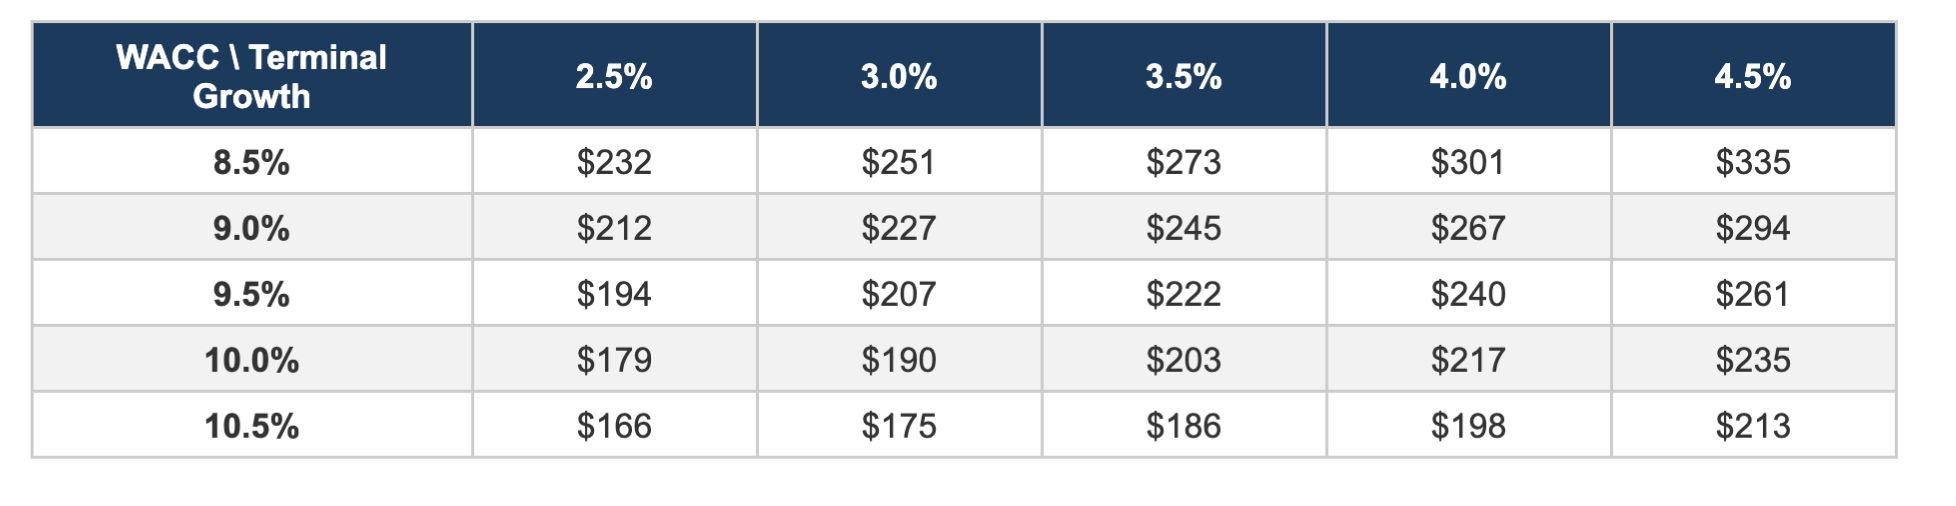
8.4 Sensitivity Analysis: Fair Value per Share
9. Projected Fair Value: 2027-2031
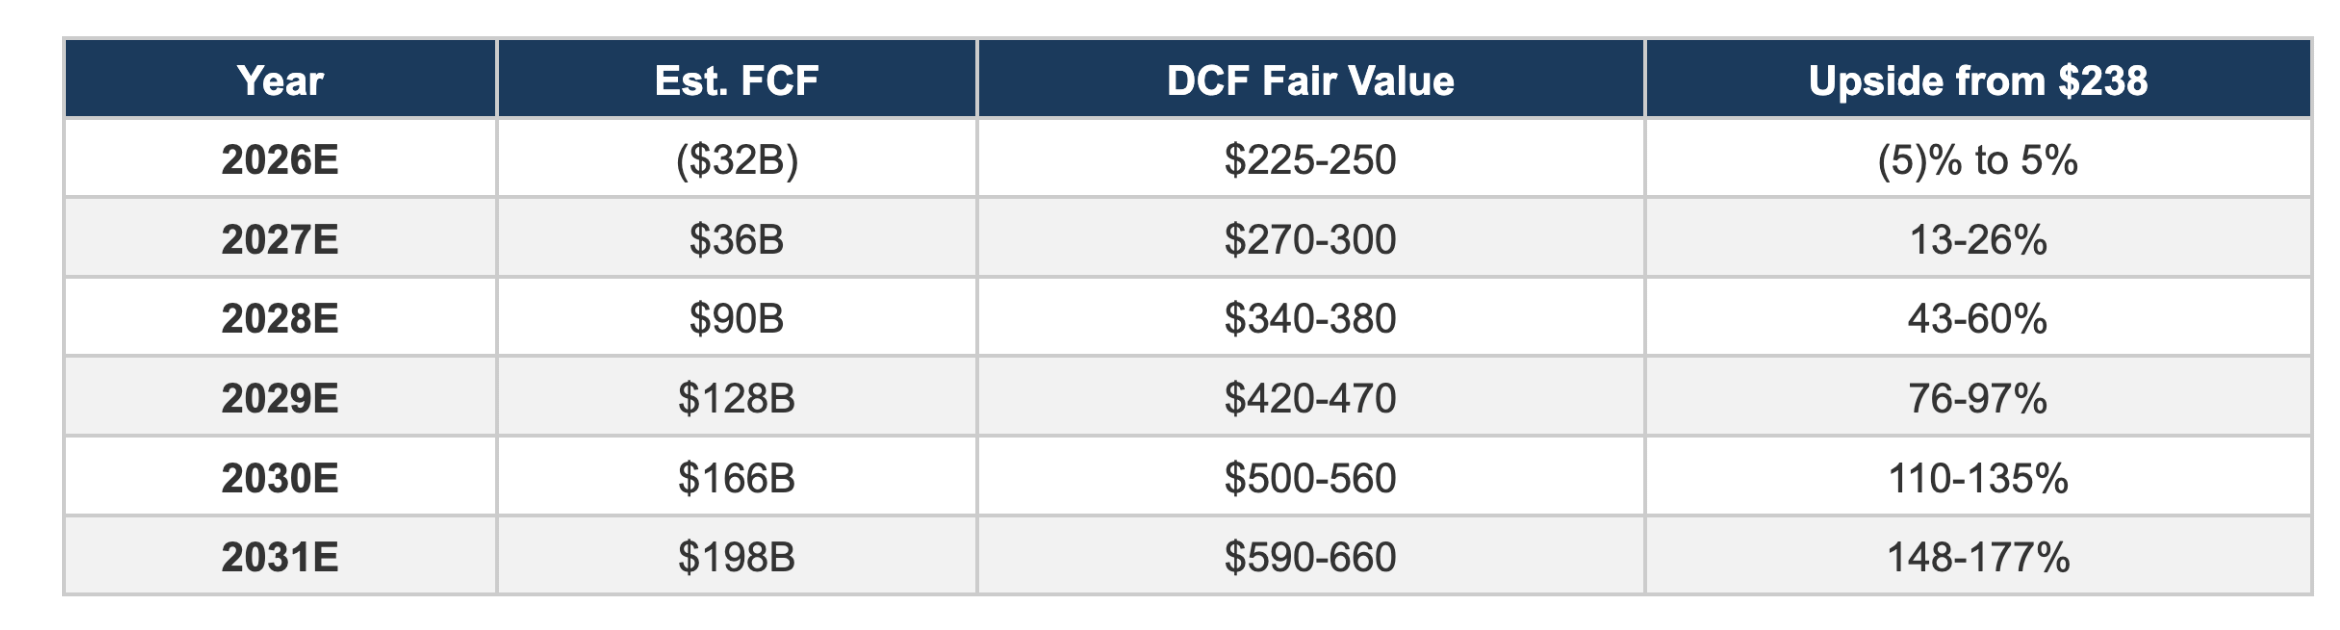
9.1 DCF-Based Fair Value Over Time
As Amazon's free cash flow ramps through the capex cycle, the DCF-implied fair value increases substantially. The heavy investment period of 2025-2027 depresses near-term FCF, but the payoff comes in 2028-2031 as AI infrastructure generates returns and capex intensity moderates.
These projections assume WACC of 8.5-9.5% and terminal growth of 3.0-4.0%. The wide ranges reflect uncertainty around AI monetization timelines and capex efficiency.
10. Valuation: Price/Earnings (P/E) Framework
10.1 Methodology
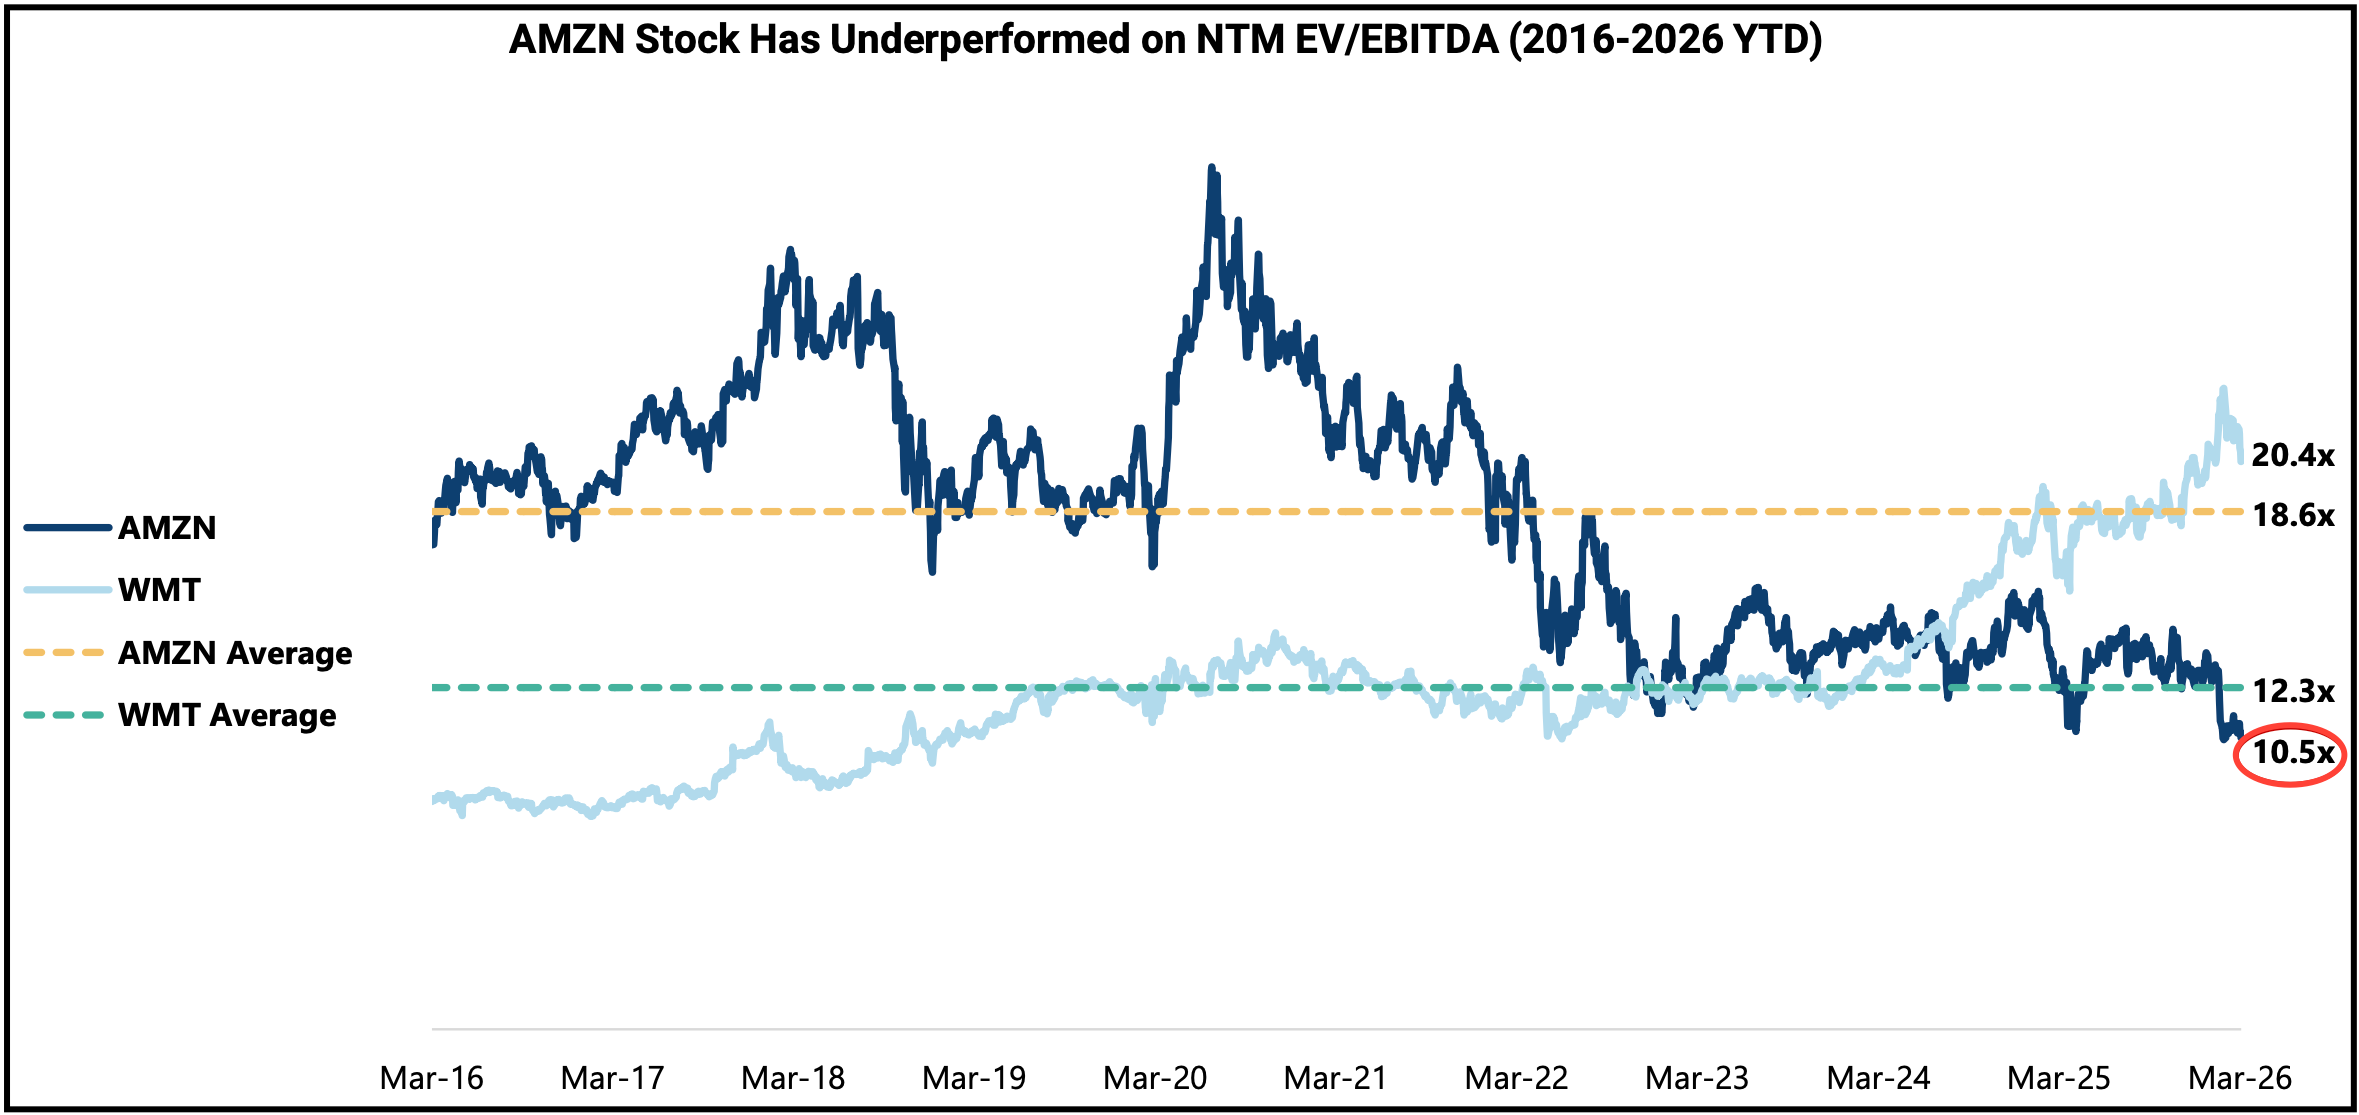
We also model Amazon’s stock price using a forward P/E multiple applied to projected earnings. Amazon currently trades at approximately 10.5x forward earnings — 44% below its 10-year average of 18.6x — and below Walmart (20.4x), an extraordinary discount for a company growing revenue at 12% with margins expanding toward 20%. On a PEG basis, AMZN trades at just 0.8x versus a peer median of 1.6x, implying a roughly 50% valuation discount relative to its growth profile.
One reason for confidence in our estimates: Amazon has beaten operating income guidance for 15 consecutive quarters, with an average 24% beat versus guidance midpoint since Q1 2024. Management’s conservative guidance philosophy means our projections, which may look aggressive, are broadly consistent with the company’s own established trend of under-promising and over-delivering.
Additionally, we have seen this before: Google's NTM EV/EBITDA bottomed at 9.6x in Q1 2025 when the market priced it as an "AI loser" facing existential search disruption — then nearly doubled to 19.1x as Gemini's progress validated its AI strategy, re-rating the stock well above its 10-year average of 12.7x.
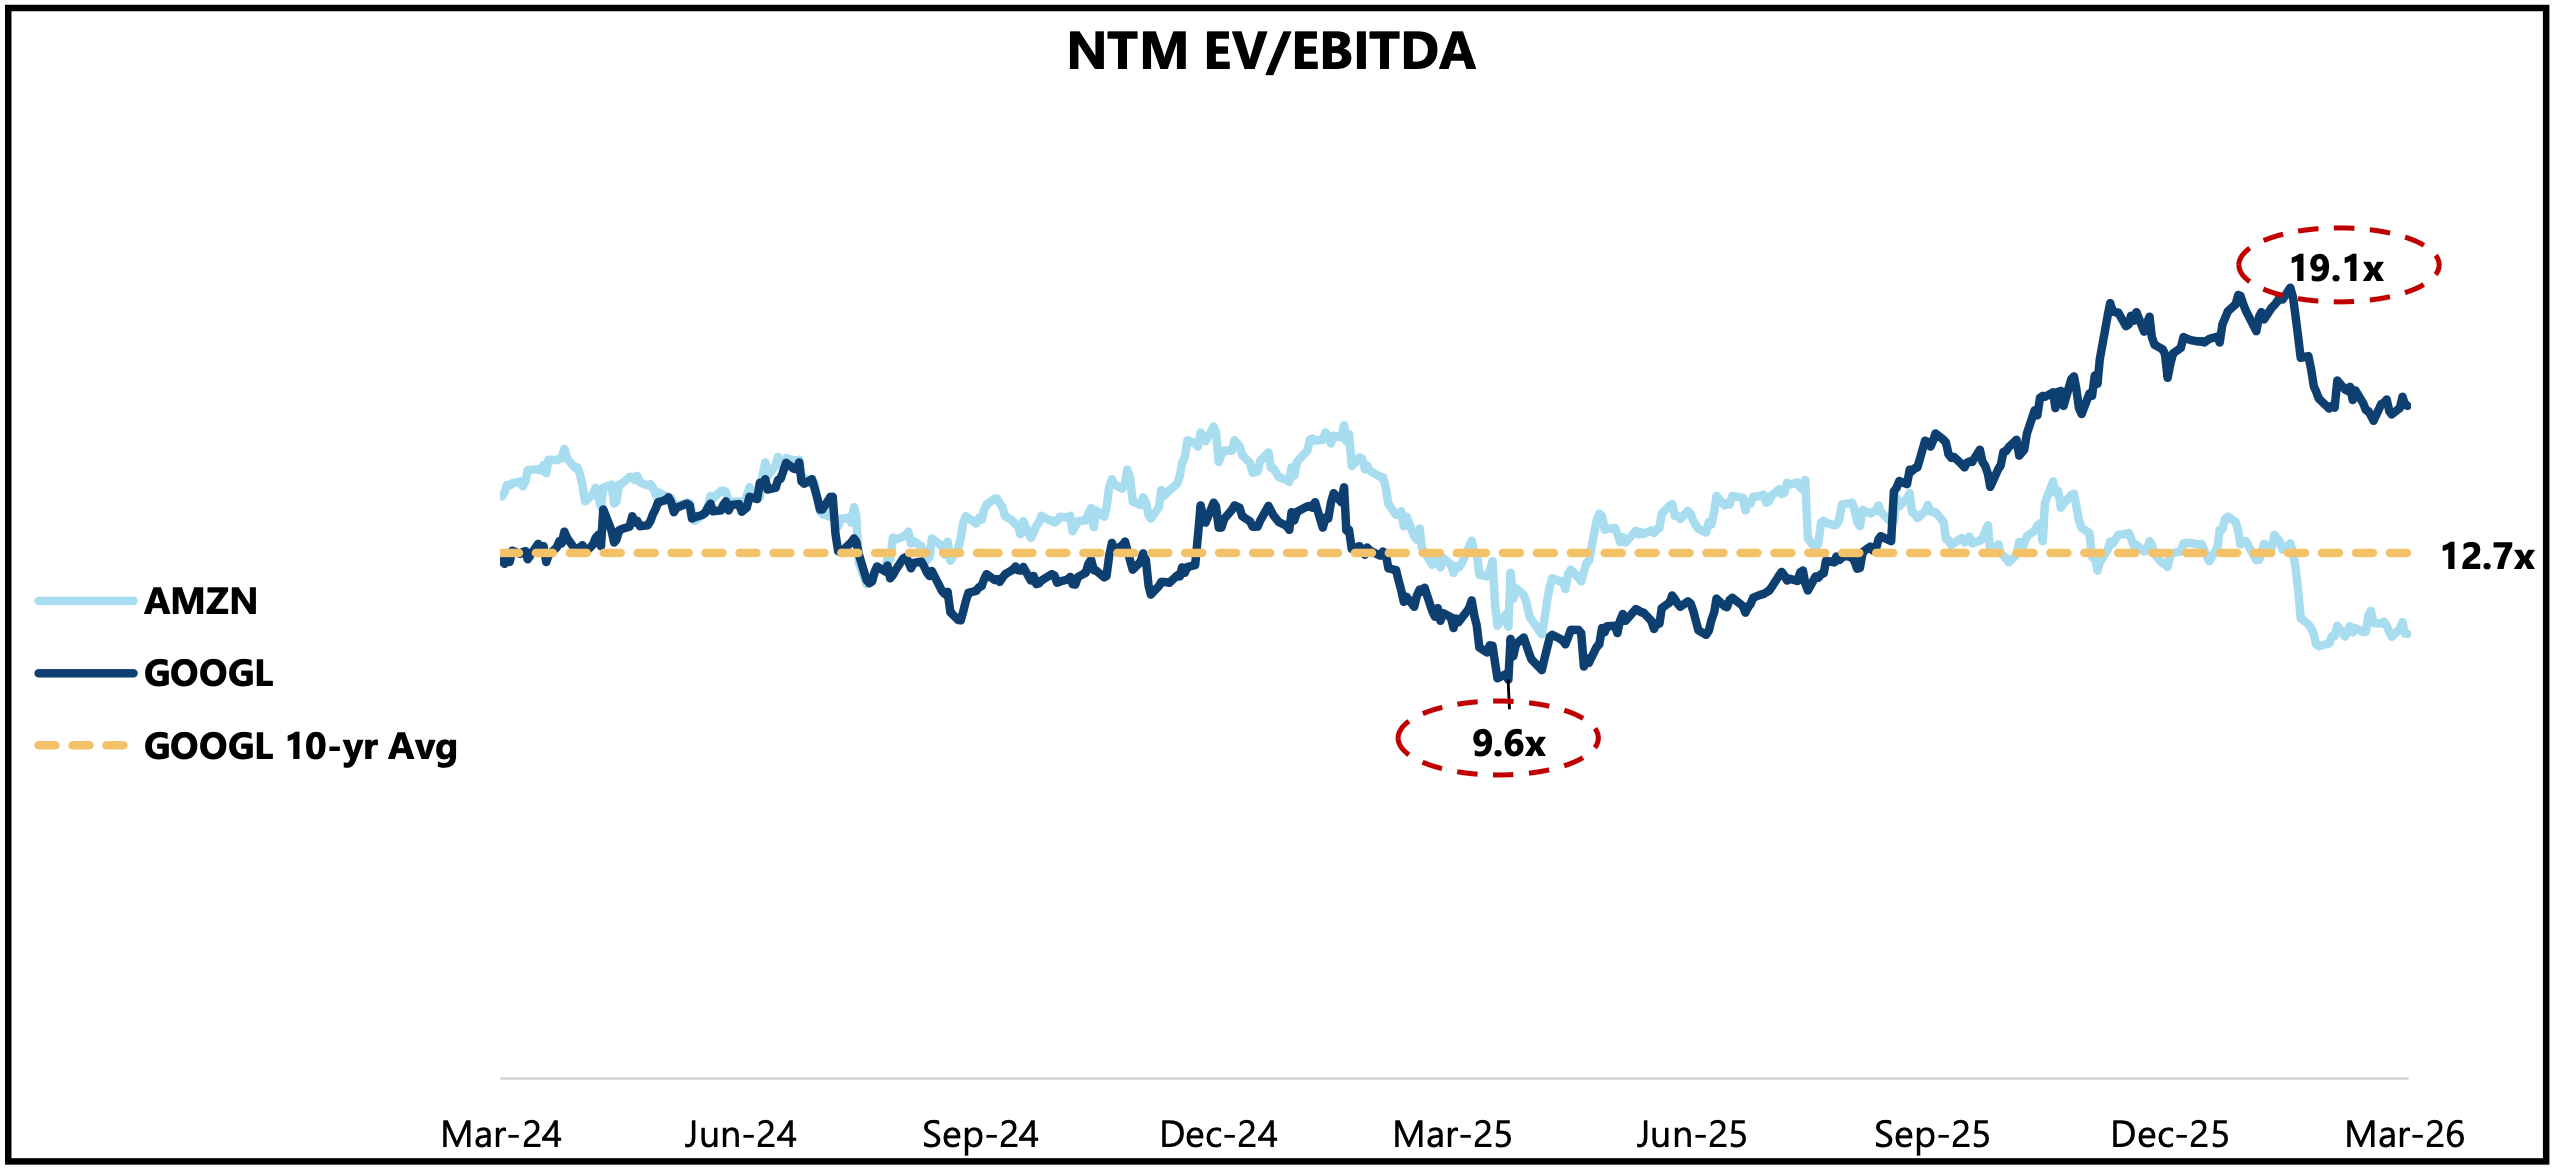
Amazon finds itself in a strikingly similar position today: the market remains fixated on the $200 billion capex burden and near-term FCF compression, while underweighting the $344 billion signed backlog, the Anthropic and OpenAI revenue ramps, and the structural margin expansion that the AI infrastructure build will unlock. If GOOGL's re-rating is any guide, the market tends to reward AI conviction once execution becomes undeniable — and Amazon's Q1 and Q2 2026 earnings may be that catalyst.
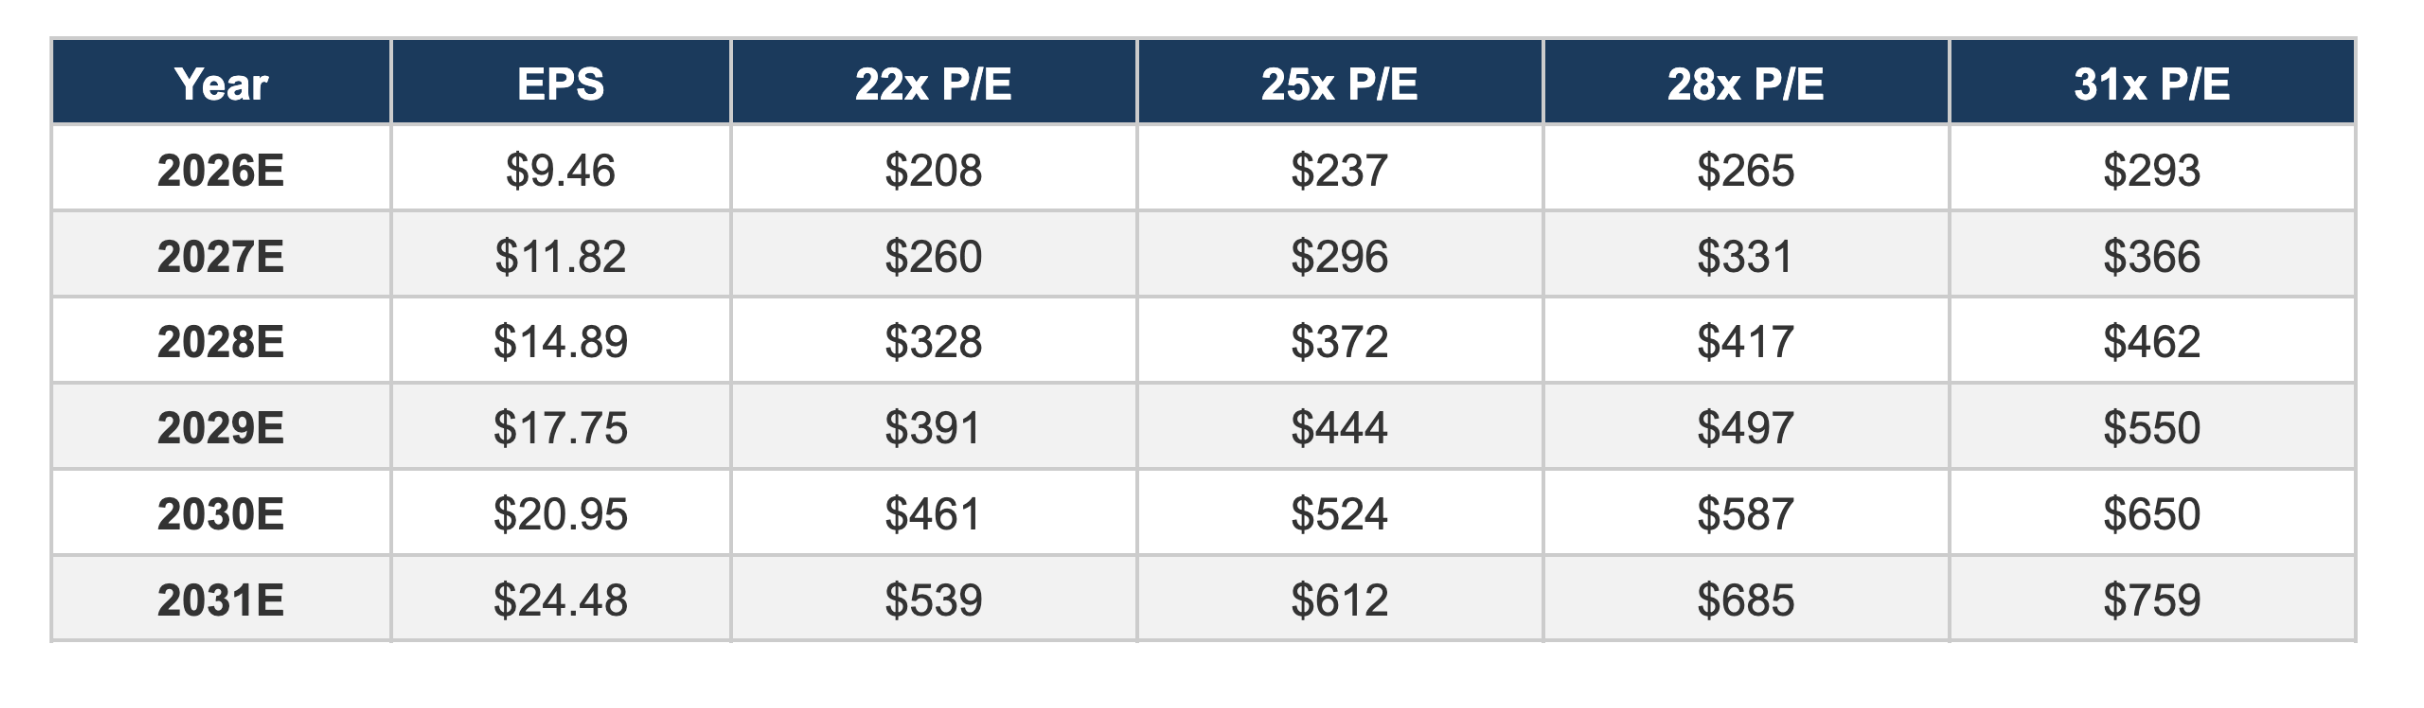
We use a forward P/E multiple applied to projected earnings. As the business matures and margins expand, we expect the P/E multiple to gradually compress toward 25-28x, but we use a range of multiples to capture different scenarios.
10.2 Net Income and EPS Projections
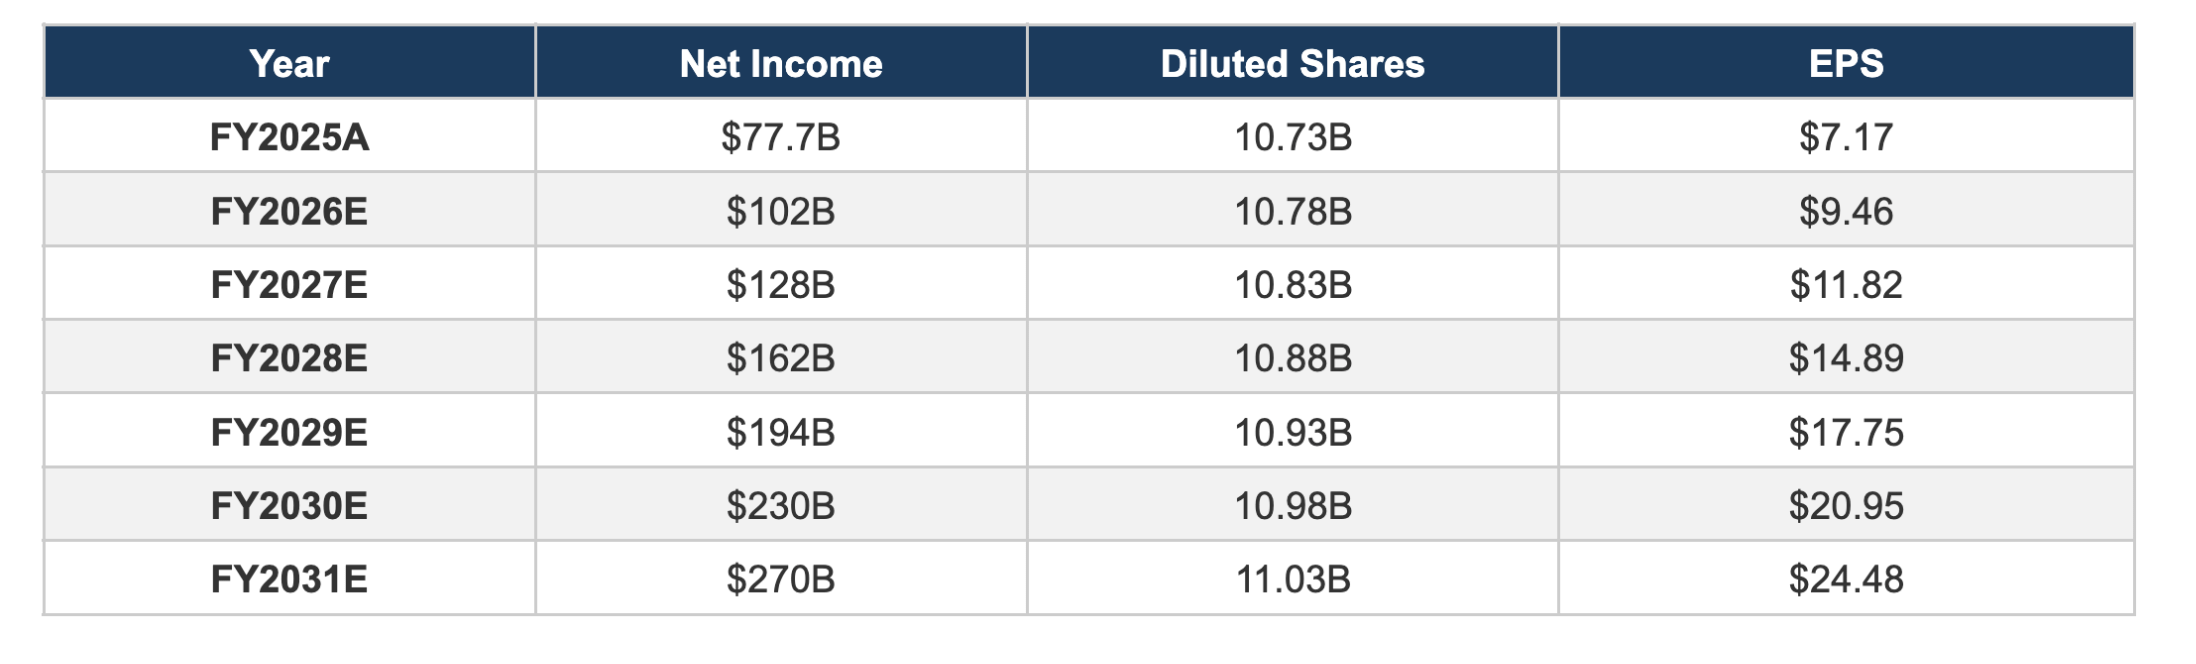
10.3 Implied Stock Price at Various P/E Multiples
10.4 Base Case Price Targets
Our base case assumes P/E compression from ~30x today to ~27x by 2028 and ~25x by 2031, reflecting Amazon's transition from a high-growth to a mega-cap compounder:
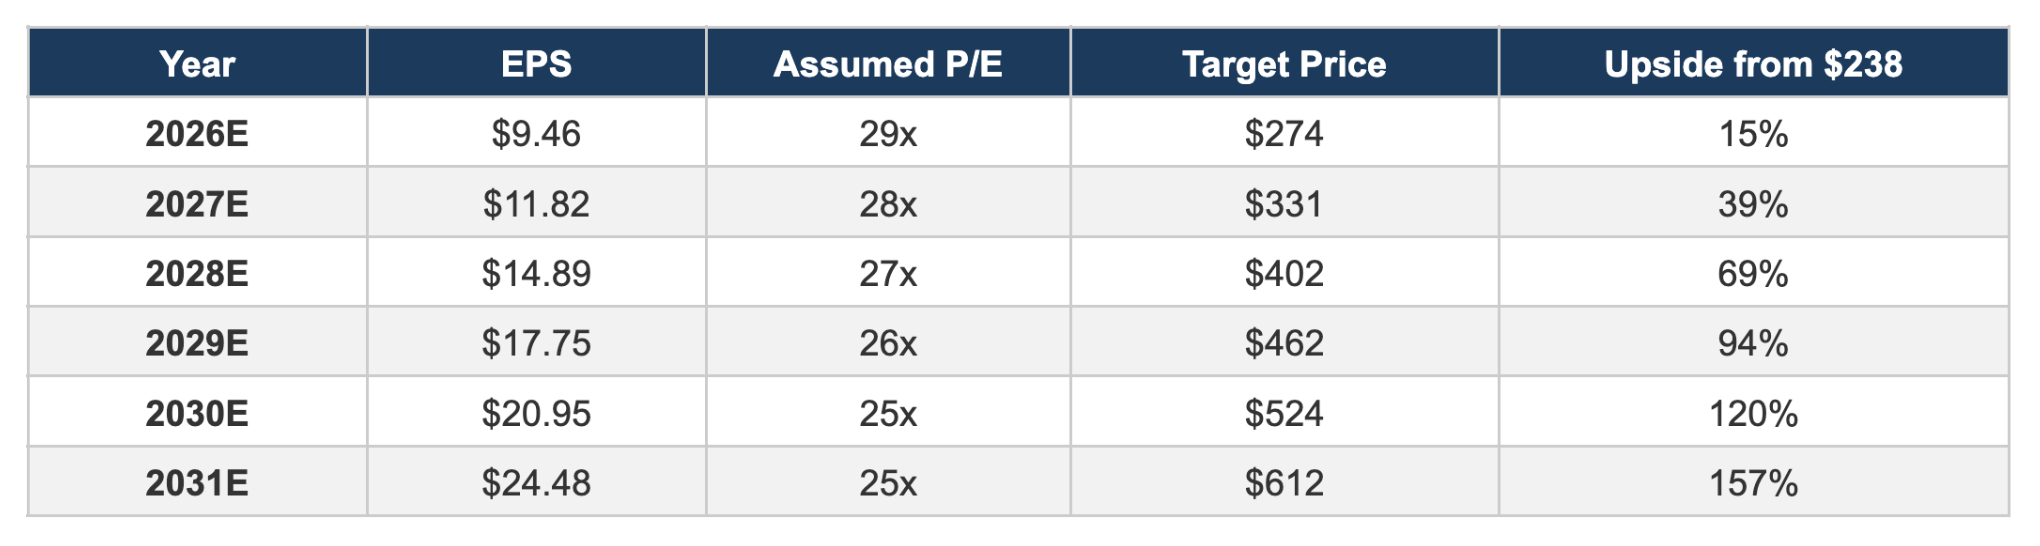
At our base-case assumptions, Amazon more than doubles from current levels by 2031, implying a ~16% annualized return. Both the P/E and DCF frameworks converge in the $500-560 range by 2031, providing cross-validation.
11. Key Risks
Regulatory & Antitrust: Amazon faces ongoing antitrust scrutiny in the U.S. (FTC lawsuit), EU (Digital Markets Act), and India. Forced marketplace separation or restrictions on self-preferencing could impair the flywheel.
CapEx Overshoot: The $200 billion 2026 capex plan is enormous. If AI monetization takes longer than expected, returns on invested capital could disappoint, pressuring margins and FCF.
Cloud Competition: Azure and GCP are investing aggressively. Enterprise customers increasingly pursue multi-cloud strategies, which could pressure AWS pricing and market share.
Tariff & Trade Risk: New tariff regimes could increase costs for Amazon’s retail operations, particularly in electronics and consumer goods sourced from Asia.
Labor Costs & Unionization: Amazon faces growing union activity in the U.S. and Europe. A federal union ruling pending in 2026 could increase labor costs across the fulfillment network.
Custom Silicon Execution Risk: If Trainium or Graviton fail to deliver projected performance improvements, Amazon could face both higher costs and credibility damage with large AI customers.
12. Conclusion
Amazon is in the midst of the most consequential capital cycle in its history. The $200 billion 2026 capex program is a bet that AI infrastructure will be the next great platform shift, similar to the original AWS bet on cloud computing in 2006. The company’s custom silicon program provides a structural advantage that is only now becoming visible in the financials.
At ~$238, the stock trades approximately in line with our base-case DCF of $245 and appears attractively valued on a P/E basis when looking 2-3 years out. The asymmetry is compelling: if AI adoption accelerates as expected and Amazon’s capex cycle delivers the projected returns, the stock has $590-660 upside potential by 2031, implying a ~19% annualized return. The downside case, a scenario where capex returns disappoint and margins stagnate, still produces a stock worth $170-190, limiting downside to roughly 20-30% from current levels.
For long-term investors, Amazon at current levels represents an opportunity to own the infrastructure backbone of the AI era at a reasonable price. The next 12-18 months will be critical: Q1 and Q2 2026 earnings will provide the first real evidence of whether the massive AI investment is translating into revenue growth above current trajectories.
Sources
1. Amazon Q4 FY2025 Earnings Results - Futurum Group
2. Amazon SEC Filing - Q4 2025 Results
3. Amazon CEO Andy Jassy 2026 Shareholder Letter - SiliconANGLE
4. Amazon Custom Chips Could Be Worth $50B - The Next Web
5. Inside Amazon’s Trainium Lab - TechCrunch
6. Amazon Advertising Breaks New Records - Marketplace Pulse
7. Amazon Annual Ad Revenue Passes $68B - Marketing Dive
8. Amazon Prime Statistics 2026 - Yaguara
9. AWS Cloud Revenue and Market Share - CNBC
10. Amazon $200B AI Spending - 24/7 Wall St.
11. Amazon WACC & Valuation Data - ValueInvesting.io
12. Amazon Takes 50% of Third-Party Sales - TheStreet
13. Amazon Content Spending 2025 - Variety
14. Uber Joins Amazon Trainium Roster - The Next Web
15. Amazon Revenue by Segment - Stock Analysis
Disclaimer: This report is for informational and educational purposes only. It does not constitute financial advice, and the projections herein are estimates based on publicly available information and the author’s analysis. Past performance does not guarantee future results. Always conduct your own due diligence before making investment decisions.